- Home >
- Stock Photos >
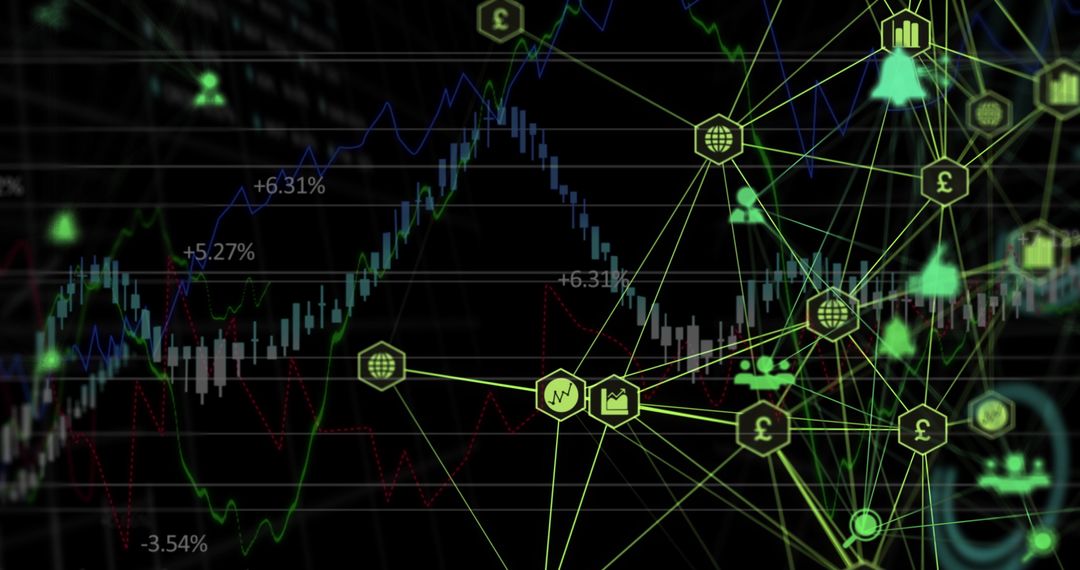
- Global Currency Symbols and Financial Network Graph
Global Currency Symbols and Financial Network Graph Image

This visual illustrates currency symbols linked over a financial graph with a grid background, representing international financial interconnections and market dynamics. Ideal for use in topics related to finance, economic trends, investment analysis, or digital financial technology services. Suitable for presentations, reports, or articles focusing on global market analysis and economic data representation.
Powered by 


0
downloads
downloads
Tags:
More
Credit Photo
If you would like to credit the Photo, here are some ways you can do so
Text Link
photo Link
<span class="text-link">
<span>
<a target="_blank" href=https://pikwizard.com/photo/global-currency-symbols-and-financial-network-graph/dbcda5cb9a0d7ca6d64af53e834721da/>PikWizard</a>
</span>
</span>
<span class="image-link">
<span
style="margin: 0 0 20px 0; display: inline-block; vertical-align: middle; width: 100%;"
>
<a
target="_blank"
href="https://pikwizard.com/photo/global-currency-symbols-and-financial-network-graph/dbcda5cb9a0d7ca6d64af53e834721da/"
style="text-decoration: none; font-size: 10px; margin: 0;"
>
<img src="https://pikwizard.com/pw/medium/dbcda5cb9a0d7ca6d64af53e834721da.jpg" style="margin: 0; width: 100%;" alt="" />
<p style="font-size: 12px; margin: 0;">PikWizard</p>
</a>
</span>
</span>
Free (free of charge)
Free for personal and commercial use.
Author: Creative Art
Similar Free Stock Images
Premium


Premium


Premium


Premium


Premium


Premium


Premium


Premium


Premium


Premium


Premium


Premium


Premium


Premium


Premium


Premium


Premium


Premium


Premium


Premium


Premium


Premium


Premium


Premium