- Home >
- Stock Photos >
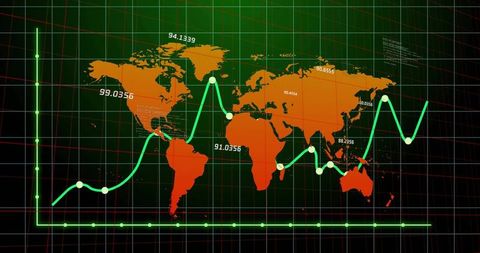
- Global Currency Symbols on Financial Data Chart
Global Currency Symbols on Financial Data Chart Image

Visualizing global financial markets with currency symbols like dollar, euro, and yen overlaying a fluctuating line graph, ideal for illustrating finance articles, economic analysis, currency exchange content, and data visualization use cases.
Powered by  - Get 15% off with code: PIKWIZARD15


0
downloads
downloads
Tags:
More
Credit Photo
If you would like to credit the Photo, here are some ways you can do so
Text Link
photo Link
<span class="text-link">
<span>
<a target="_blank" href=https://pikwizard.com/photo/global-currency-symbols-on-financial-data-chart/d935a8d61e643e811e5c1eccdab11520/>PikWizard</a>
</span>
</span>
<span class="image-link">
<span
style="margin: 0 0 20px 0; display: inline-block; vertical-align: middle; width: 100%;"
>
<a
target="_blank"
href="https://pikwizard.com/photo/global-currency-symbols-on-financial-data-chart/d935a8d61e643e811e5c1eccdab11520/"
style="text-decoration: none; font-size: 10px; margin: 0;"
>
<img src="https://pikwizard.com/pw/medium/d935a8d61e643e811e5c1eccdab11520.jpg" style="margin: 0; width: 100%;" alt="" />
<p style="font-size: 12px; margin: 0;">PikWizard</p>
</a>
</span>
</span>
Free (free of charge)
Free for personal and commercial use.
Author: Authentic Images
Similar Free Stock Images
Loading...

Premium


Premium


Premium


Premium


Premium

Premium

Premium


Premium


Premium


Premium

Premium


Premium


Premium


Premium


Premium

Premium


Premium


Premium


Premium

Premium

Premium


Premium


Premium


Premium


Premium