
- Home >
- Stock Photos >
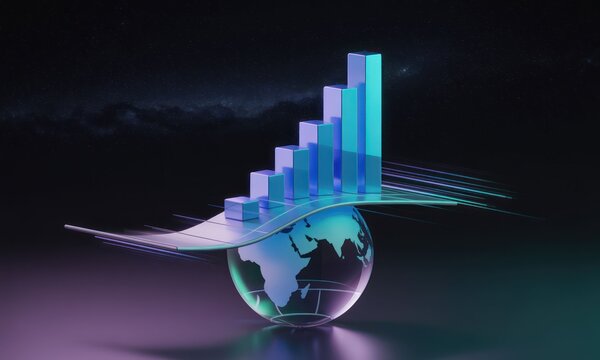
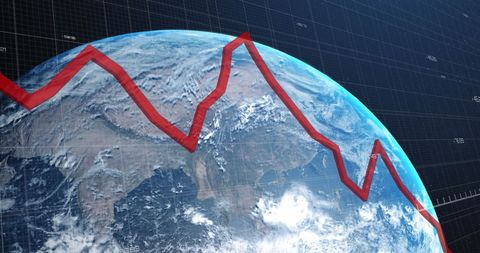
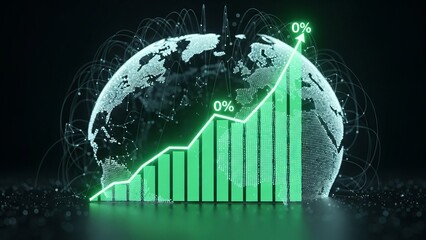
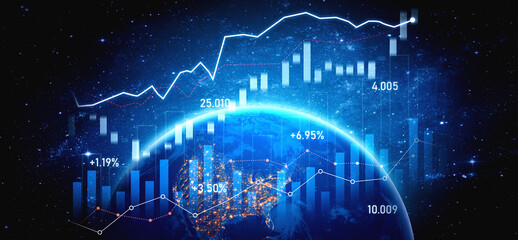
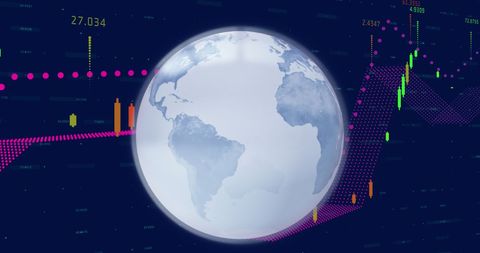
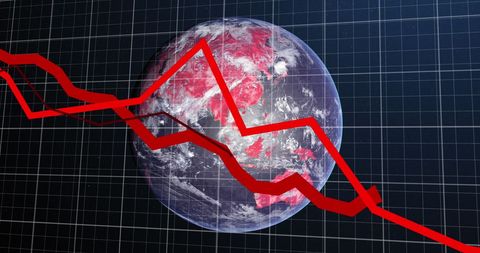
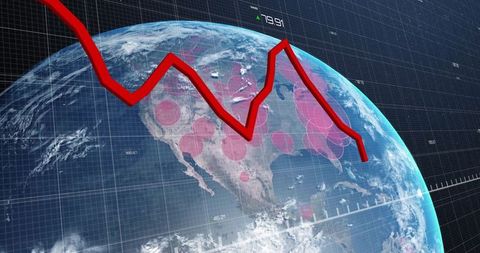
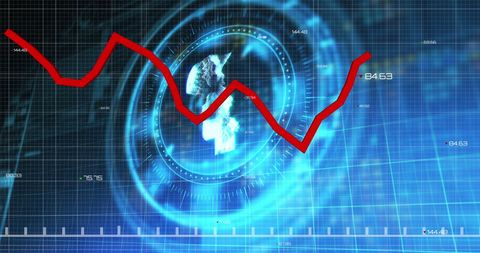
- Global Data Analysis and Financial Trends Visualization
Global Data Analysis and Financial Trends Visualization Image

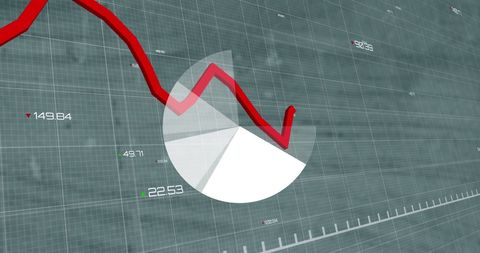
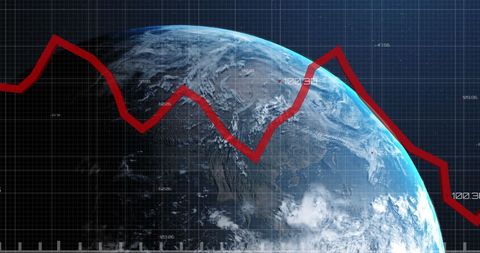
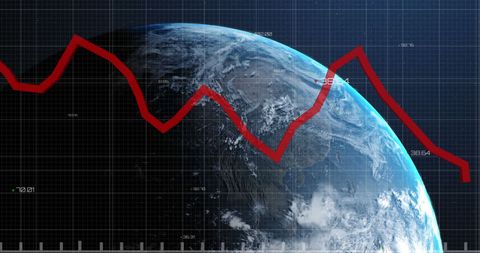
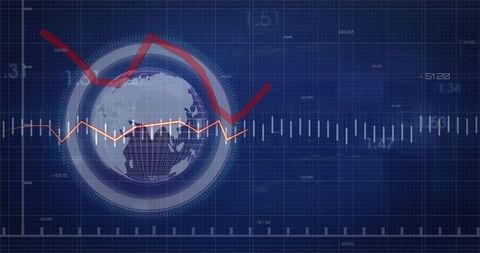
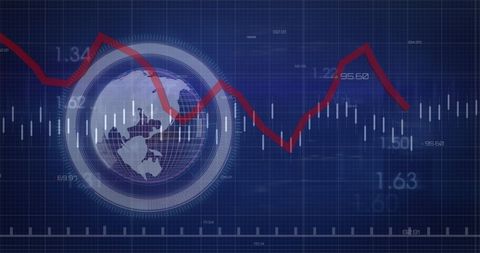
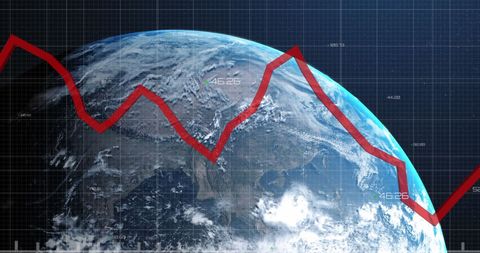
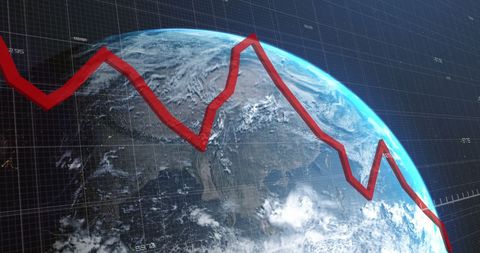
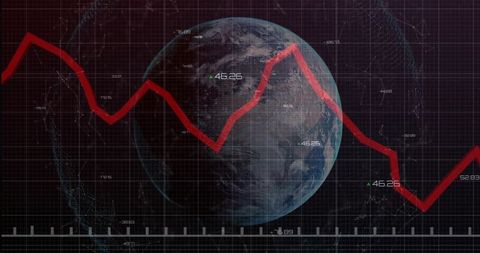
The representation shows a red line graph arching over the earth symbolizing global financial trends and data analysis. This concept is ideal for illustrating themes related to global economic fluctuations, analytics technology, and the digital processing of planetary data. Useful for finance articles, network visualization interfaces, and global business strategy presentations.
Powered by 


downloads
Tags:
More
Credit Photo
If you would like to credit the Photo, here are some ways you can do so
Text Link
photo Link
<span class="text-link">
<span>
<a target="_blank" href=https://pikwizard.com/photo/global-data-analysis-and-financial-trends-visualization/8db7e9b471db4298414d98ea2b4484a9/>PikWizard</a>
</span>
</span>
<span class="image-link">
<span
style="margin: 0 0 20px 0; display: inline-block; vertical-align: middle; width: 100%;"
>
<a
target="_blank"
href="https://pikwizard.com/photo/global-data-analysis-and-financial-trends-visualization/8db7e9b471db4298414d98ea2b4484a9/"
style="text-decoration: none; font-size: 10px; margin: 0;"
>
<img src="https://pikwizard.com/pw/medium/8db7e9b471db4298414d98ea2b4484a9.jpg" style="margin: 0; width: 100%;" alt="" />
<p style="font-size: 12px; margin: 0;">PikWizard</p>
</a>
</span>
</span>
Free (free of charge)
Free for personal and commercial use.
Author: Awesome Content
Similar Free Stock Images

Premium
Premium


Premium


Premium


Premium


Premium

Premium


Premium

Premium


Premium


Premium

Premium


Premium
Premium


Premium


Premium


Premium


Premium


Premium


Premium


Premium

Premium


Premium


Premium


Premium


Explore More Free Stock Images