1. Home > 
  2. Stock Photos > 
  3. Global Data Analysis with Rising Graphs and World Map

Global Data Analysis with Rising Graphs and World Map Image

Global Data Analysis with Rising Graphs and World Map

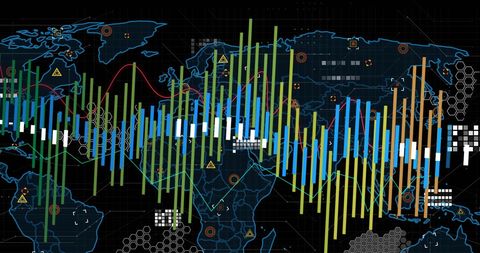
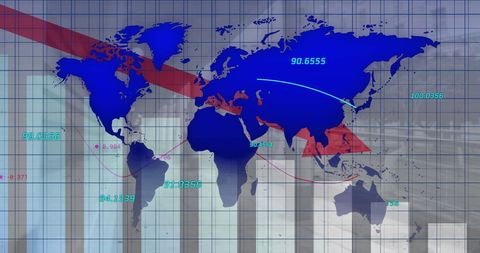
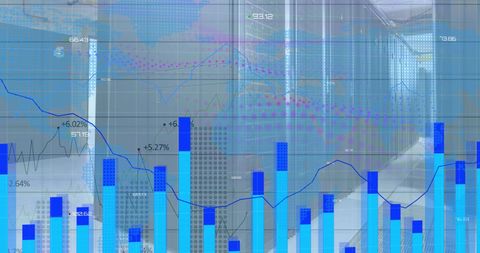
This artwork features dynamic graphs and a textured world map, symbolizing global data analysis and business growth. Ideal for depicting concepts related to technology, financial growth, or international business trends. Use it for presentations, reports, or marketing materials to emphasize the importance of data-driven decisions in a connected world.

Powered by Shutterstock logo - Get 15% off with code: PIKWIZARD15
Two diverse crypto traders brokers stock exchange market investors discussing trading charts research reports growth using pc computer looking at screen analyzing invest strategy, financial risks. - Powered by Shutterstock - Get 15% off with code: PIKWIZARD15Business finance data analytics graph.Financial management technology.Advisor using KPI Dashboard on virtual screen. - Powered by Shutterstock - Get 15% off with code: PIKWIZARD15Internet cyberspace data information collection analytical statistics computer storage ai artificial intelligence calculation, blue background banner copyspace. - Powered by Shutterstock - Get 15% off with code: PIKWIZARD15Man look at the dashboard with graphs and charts. Concept of data management system, business intelligence, data statistics, marketing analysis, key performance indicators (KPI) and analytics. - Powered by Shutterstock - Get 15% off with code: PIKWIZARD15Stockmarket online trading chart candlestick on crypto currency platform. Stock exchange financial market price candles graph data pattern analysis concept. Computer screen closeup background - Powered by Shutterstock - Get 15% off with code: PIKWIZARD15

Credit Photo

If you would like to credit the Photo, here are some ways you can do so

Free (free of charge)

Free for personal and commercial use.

Author: Authentic Images

Similar Free Stock Images

Global Economy Trends with Digital Graph Visualization
Premium
Business finance data analytics graph.Financial management technology.Advisor using KPI Dashboard on virtual screen.
Global Data Analytics with World Map and Bar Graph
Digital Data Graph Overlays on Urban Cityscape
Global Data Processing with World Map and Server Graphics
Abstract Financial Technology Visualization with Digital Graph and Shapes
Premium
Stock market or forex trading graph on touchscreen,  finance and investment concept. Economy trends for business, financial charts and digits.
Global Financial Market Downturn Depicted on Digital World Map
Economic Decline in Czech Republic with Financial Graphs
Economic Downtrend Concept with Decreasing Bar Graphs and Arrow
Downward Trend in Global Finances with Digital Interface Elements
Premium
Businessman using pen touch candle chart financial growth of business and world economy. Stock market price increase. Stock market investment analysis, financial risk management and investment.
Complex Data Analysis with Interactive Charts and Arrows
Futuristic Infographic Commissioning Data Analysis with Graphics
Global Digital Interface with Interactive Data Visualization
Global Financial Data Visualization Over World Map
Premium
Man look at the dashboard with graphs and charts. Concept of data management system, business intelligence, data statistics, marketing analysis, key performance indicators (KPI) and analytics.
Global Data Processing with Digital Maps and Graphs
Global Financial Data Processing on Abstract World Map
Global Finance Analytics with Data Visualization Elements
Global Financial Market Positive Trend Visualization
Premium
Corporate Office Meeting. Multiracial Team Discussing Strategic Planning and Business Development Together.
Digital Financial Data Visualization Concept with Chart Overlay
Global Data Analytics with Interactive World Map and Diagrams
Global Data Flow and Digital Interface on World Map
Digital Financial Data Processing with Futuristic Cityscape Background
Premium
Stock graph and financial chart. Analyze stock market finance volume of stock market with Graph and chart holograph technology. High quality photo
Digital Data Analysis Over World Map with Graphs and Codes
Colorful Financial Graph Showing Market Volatility
Graph with Red Arrow Symbolizing Economic Downturn on DNA Background
Global Data Visualization with Interactive Graphs and Network Nodes
Abstract Financial Data Visualization with Dynamic Graphs
Downward Trend in Financial Data Analysis Conceptual Illustration
Premium
Data and AI Powering Global Analytics: Visualize data-driven insights with AI and big data, showcasing global networks, large language models, artificial neural network and digital transformation.
Global Finances Downtrend with Digital Business Keywords Overlay
Global Data Analytics Over Computer Servers
Financial Data Visualization and Digital Analysis with World Map
Digital World Map and Dynamic Data Visualization
Premium
Young indian business man trader wearing glasses looking at computer screen with trading charts reflecting in eyeglasses watching stock trading market financial data growth concept, close up.
Global Stock Market Analysis with Digital Graph Overlay
Global Financial Data Visualization on Digital Map
Vibrant Bar Graph and Digital Data Analysis Interface
Futuristic Global Data Analysis on Digital World Map
Premium
Online trading, Investment, Strategy market plan, and Stock mark
Colorful Graphs Indicating Financial Data Analysis Over Grid Background
Rising Arrow Over Global Bar Graph in Data-Driven Digital World
Global Financial Data Visualization with World Map and Graphs
Global Data Analytics and Technology Visualization
Premium
Businessman holding tablet with growing virtual hologram of statistics, graph and chart.Business strategy development and growing growth plan. Investment of growth on currency rate.
Global Data Analytics Visualized on World Map Interface
Dynamic Financial Graph Dropping Beneath Statistical Visualization
Financial Data Processing and Analysis with Digital Interface
Financial Data Analysis and Market Trends Visualization
Premium
Business finance and investment, Analyze economic growth charts for informed business finance decisions and financial decision-making. Stock Market report, Strategy, Data Collection, Forecasting
Digital Financial Chart with Stock Market Data and Analytics
Global Financial Data and Stock Market Visualization
Business Data Processing and Digital Economy Concepts
Abstract Data Visualization with Graphs over Digital Grid Background
Premium
Serious business man trader analyst looking at computer monitor, investor broker analyzing indexes, financial chart trading online investment data on cryptocurrency stock market graph on pc screen.
Global Financial Data and Trends with Digital Earth Background
Colorful Data Visualization and Analytics Interface on Dark Grid
Digital Interface with Rising Bar Graphs and Trend Lines
Dynamic Graph Lines Over Digital Grid Background
Financial Data Processing Over Cityscape Urban Analysis
Global Financial Market Analysis With Data Visualization
Premium
young entrepreneur using big data analysis and cloud technology to collect customer data and display on application dashboard from digital tablet to understand sale forecast and marketing plan.
Financial Market Trends on Russian Flag Background
Dynamic Global Financial Technology Visualization
Global Data Processing with Dynamic Graphs Overlay
Digital Financial Data Chart with Dynamic Analytics Graphs
Premium
Statistics of business concept. Finance chart. Financial planning. Data analysis.
Downward Financial Trend with Data Visualization Elements
Data Security Concept with Padlock and Digital Interface
Financial Downturn Illustrated by Descending Red Arrow and Data
Abstract Financial Graphs and Data Overlaid on Server Room
Premium
Stock market graph trading analysis investment financial, stock exchange financial or forex graph stock market graph chart business crisis crash loss and grow up gain and profits win up trend.
Global Data Visualization on World Map Over Cityscape
Abstract Financial Data Analysis with World Map Background
Global Financial Data Analysis with World Map Background
Financial Growth Graph Over Urban Skyline with Currencies
Premium
Business analysis, trading concept, Businessman, finance analyst using digital tablet, analyzing financial graph, stock market report, economic graph growth chart, business and technology background
Dynamic Data Display with Bars and Lines on Grid Background
Digital Financial Data Analytics with Global Charts and Currencies
Financial Data and Stock Market Decline Visualization
Digital Global Map with Blue Bar Graphs and Data Analytics Overlay
Premium
Financial business accounting and banking.Growing virtual hologram of statistics, graph and chart. Investment of growth on currency rate.Digital marketing concept.
Digital Financial Graphs Overlapping Modern Office Scene
Digital Data Analysis Over World Map Illustrating Global Connections
Data Processing Overlaid on Dynamic Global Map with Graphs
Global Data Trends and Analytics Visualized Over World Map
Premium
Businessman points a graph depicting the growth of business, data analysis in shaping a thriving global enterprise of blockchain technology and strategic planning in the modern business
Dynamic Financial Dashboard Depicting Business Analytics
Global Financial Data Dashboard Showing Interactive Bar Charts, Line Trends, and World Map
Digital Decline in Finance Graph with Red Downward Arrow
Financial Growth Graphs Against Cityscape with Equalizer Effect
Abstract Blue Digital Chart with Global Connections
Global Financial Data Analytics Concept with Blue Graphs
Premium
young entrepreneur using big data analysis and cloud technology to collect customer data and display on application dashboard from digital tablet to understand sale forecast and marketing plan.
Financial Growth and Market Trends Over Urban Skyline
Global Financial Data Processing with Graphs and Charts Overlay
Futuristic Financial Analytics with Data Charts and Graphs
Digital Interface with Graphs and World Map in Blue Tones
Premium
Stock market analysis, business, finance and investment. Finance analyst analyzing stock market trading graph, economic growth chart, planning and strategy, business investment with financial report
Advanced Data Processing with Digital Interface Elements
Global Financial Data Analysis on World Map
Futuristic Global Data Analytics with World Map Overlay
Digital Network of Eco-Friendly Icons Overlaying World Map
Premium
The 2025 new year business goals concept. Businessman touching increase arrow graph company future growth 2025. Business plan target strategy, Planning and challenge business strategy in new year,
Visualizing Innovative Data Analytics with Digital Wave Imagery
Digital Visualization of Data and Global Connectivity Concept
Global Data Visualization with Digital World Map and Graphs
Global Business Analytics and Social Media Metrics
Premium
Businessman pointing chart financial goals and economic business planning global.
Global Financial Trends with Arrow Indicating Economic Shift
Financial Growth Trends with Digital Overlay in City
Global Financial Data Visualization with Charts on Digital Map
Global Financial Data Analysis with Digital World Map Visualization
Premium
Trader analyzing data on virtual screen.Price graph and indicator. Stock market invest and crypto currency. Stock market and business investment.
Dynamic Financial Data Analytics with Global Technology Perspectives
Global Finances and Data Analysis with World Map Overlay
Global Financial Decline Visualization on World Map
Abstract Data Interface with World Map and Bar Charts
Premium
Business man holding tablet and showing holographic graphs and stock market statistics gain profits. Concept of growth planning and business strategy. Display of good economy form digital screen.
Displaying Neon Financial Candlestick and Bar Dashboard with Line Graphs and Halftone Grid