
- Home >
- Stock Photos >
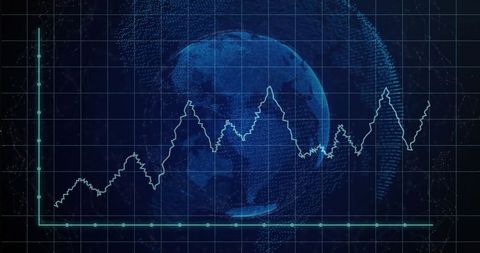
- Global Data Analysis with World Map and Pulse Wave
Global Data Analysis with World Map and Pulse Wave Image

Visual representation emphasizes global data processing with a dynamic world map and pulse wave. Useful for presentations on international tech, finance sectors, or analytics-related content. Highlights connectivity and modern interface capabilities.
Powered by 


downloads
Tags:
More
Credit Photo
If you would like to credit the Photo, here are some ways you can do so
Text Link
photo Link
<span class="text-link">
<span>
<a target="_blank" href=https://pikwizard.com/photo/global-data-analysis-with-world-map-and-pulse-wave/823b50f40815b0ed1c6cafc2ce2b05e7/>PikWizard</a>
</span>
</span>
<span class="image-link">
<span
style="margin: 0 0 20px 0; display: inline-block; vertical-align: middle; width: 100%;"
>
<a
target="_blank"
href="https://pikwizard.com/photo/global-data-analysis-with-world-map-and-pulse-wave/823b50f40815b0ed1c6cafc2ce2b05e7/"
style="text-decoration: none; font-size: 10px; margin: 0;"
>
<img src="https://pikwizard.com/pw/medium/823b50f40815b0ed1c6cafc2ce2b05e7.jpg" style="margin: 0; width: 100%;" alt="" />
<p style="font-size: 12px; margin: 0;">PikWizard</p>
</a>
</span>
</span>
Free (free of charge)
Free for personal and commercial use.
Author: Authentic Images
Similar Free Stock Images

Premium


Premium

Premium


Premium

Premium

Premium


Premium


Premium


Premium


Premium


Premium


Premium


Premium


Premium

Premium

Premium


Premium


Premium


Premium


Premium


Premium

Premium


Premium


Premium


Premium


Explore More Free Stock Images