- Home >
- Stock Photos >
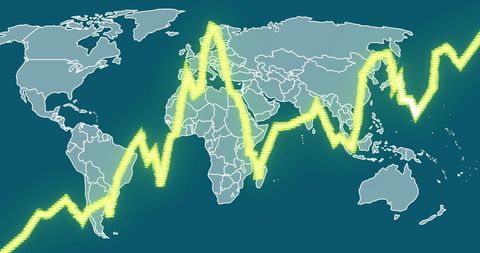
- Global Data Analytics and Business Growth Visualization
Global Data Analytics and Business Growth Visualization Image

Visual representation portraying the dynamic nature of global business and finance. Ideal for illustrating themes related to international trade, economic growth, and the influence of data analytics and technology on business development.

downloads
Tags:
More
Credit Photo
If you would like to credit the Photo, here are some ways you can do so
Text Link
photo Link
<span class="text-link">
<span>
<a target="_blank" href=https://pikwizard.com/photo/global-data-analytics-and-business-growth-visualization/74dbde1de6e1a3b9b2cf311e77b94afc/>PikWizard</a>
</span>
</span>
<span class="image-link">
<span
style="margin: 0 0 20px 0; display: inline-block; vertical-align: middle; width: 100%;"
>
<a
target="_blank"
href="https://pikwizard.com/photo/global-data-analytics-and-business-growth-visualization/74dbde1de6e1a3b9b2cf311e77b94afc/"
style="text-decoration: none; font-size: 10px; margin: 0;"
>
<img src="https://pikwizard.com/pw/medium/74dbde1de6e1a3b9b2cf311e77b94afc.jpg" style="margin: 0; width: 100%;" alt="" />
<p style="font-size: 12px; margin: 0;">PikWizard</p>
</a>
</span>
</span>
Free (free of charge)
Free for personal and commercial use.
Author: People Creations