- Home >
- Stock Photos >
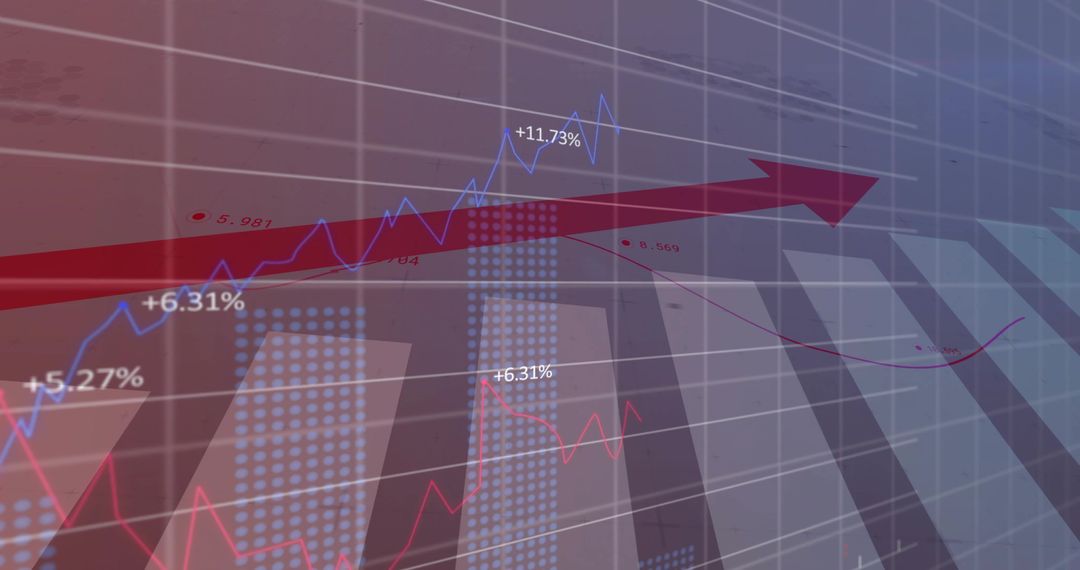
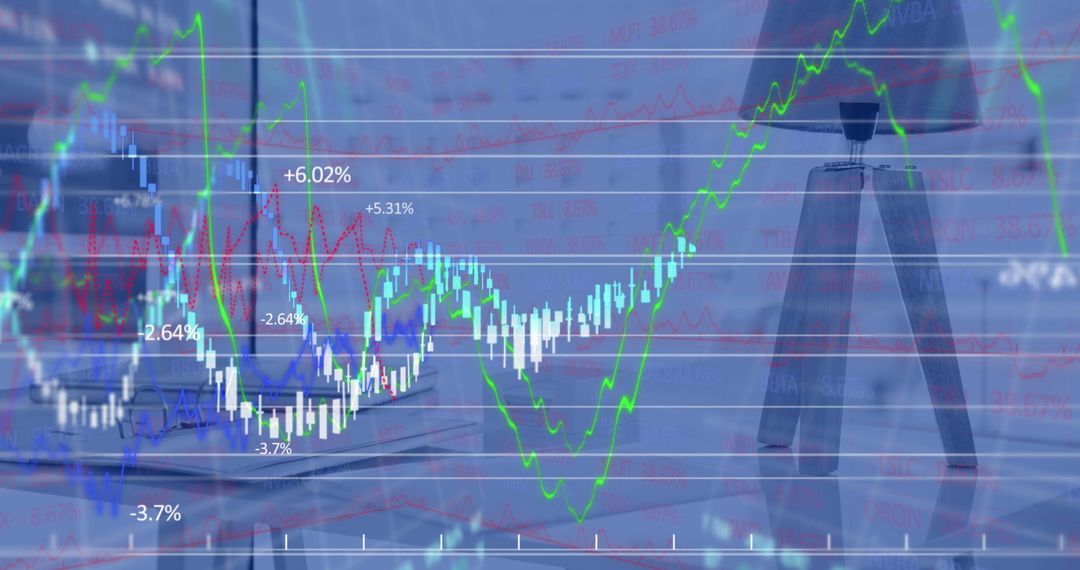
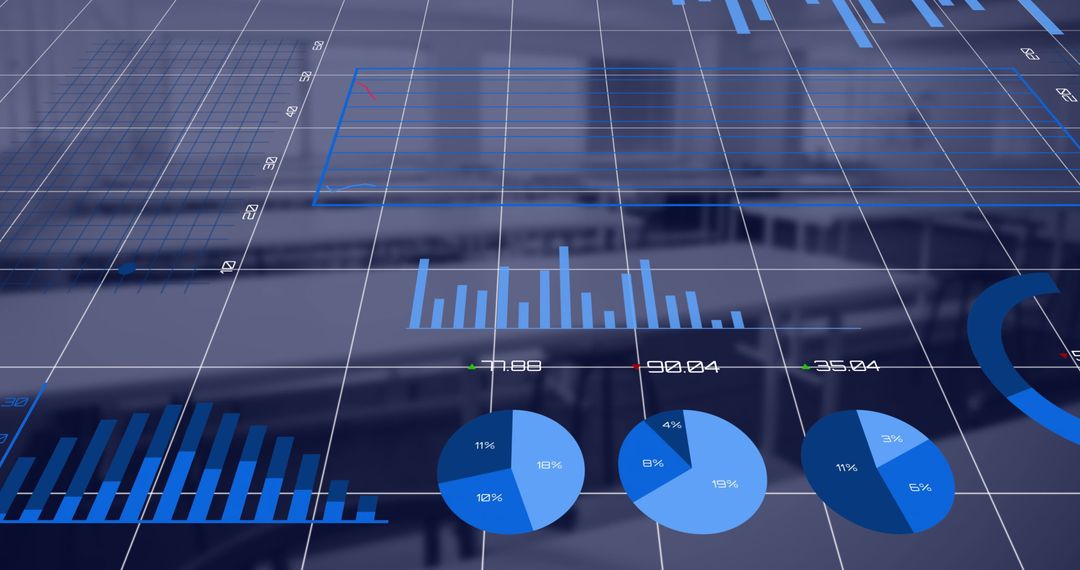
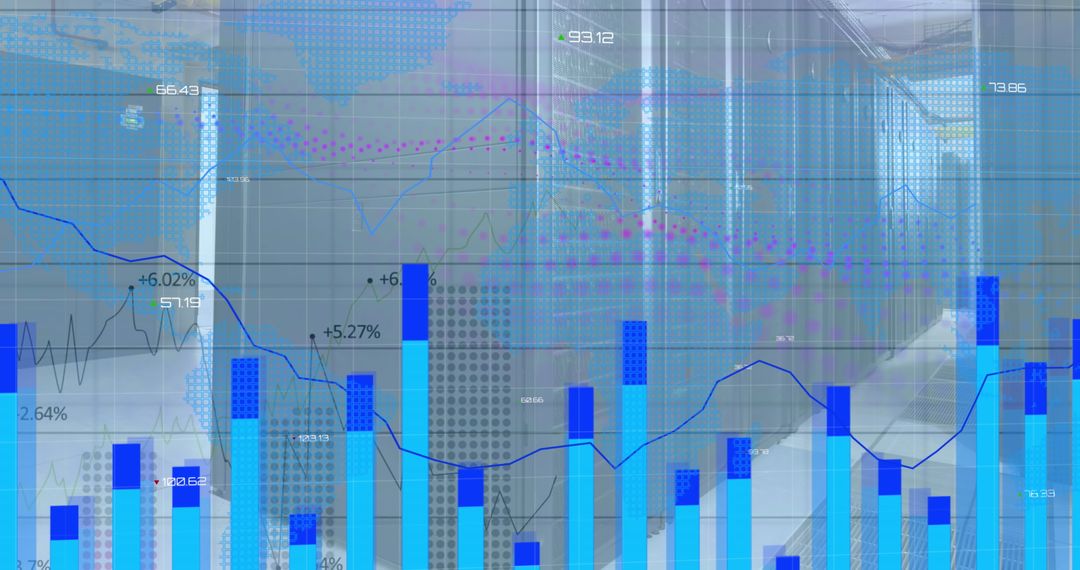
- Global Data Analytics and Financial Metrics Concept
Global Data Analytics and Financial Metrics Concept Image

Visual representation of global data analytics with various charts and statistics overlaying empty room. Useful for illustrating concepts of financial analysis, market trends, data science, or digital technology in business presentations, reports, or educational materials.
Powered by 


0
downloads
downloads
Tags:
More
Credit Photo
If you would like to credit the Photo, here are some ways you can do so
Text Link
photo Link
<span class="text-link">
<span>
<a target="_blank" href=https://pikwizard.com/photo/global-data-analytics-and-financial-metrics-concept/a0c72a04e51eaa51ed158ab7fd1357c2/>PikWizard</a>
</span>
</span>
<span class="image-link">
<span
style="margin: 0 0 20px 0; display: inline-block; vertical-align: middle; width: 100%;"
>
<a
target="_blank"
href="https://pikwizard.com/photo/global-data-analytics-and-financial-metrics-concept/a0c72a04e51eaa51ed158ab7fd1357c2/"
style="text-decoration: none; font-size: 10px; margin: 0;"
>
<img src="https://pikwizard.com/pw/medium/a0c72a04e51eaa51ed158ab7fd1357c2.jpg" style="margin: 0; width: 100%;" alt="" />
<p style="font-size: 12px; margin: 0;">PikWizard</p>
</a>
</span>
</span>
Free (free of charge)
Free for personal and commercial use.
Author: Creative Art
Similar Free Stock Images
Premium


Premium


Premium


Premium


Premium


Premium


Premium


Premium


Premium


Premium


Premium


Premium


Premium


Premium


Premium


Premium


Premium


Premium


Premium


Premium


Premium


Premium


Premium


Premium