- Home >
- Stock Photos >
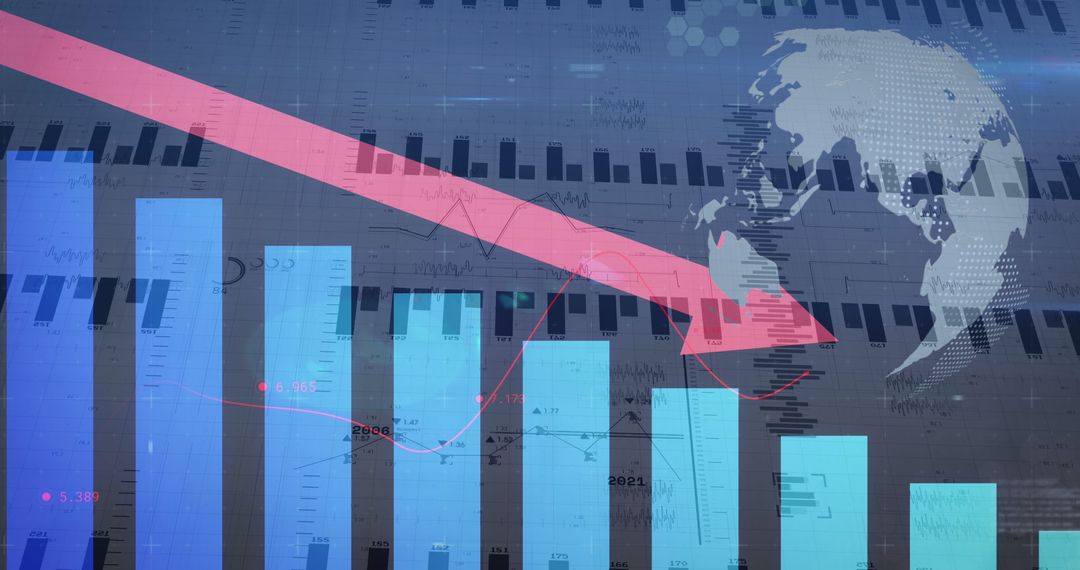
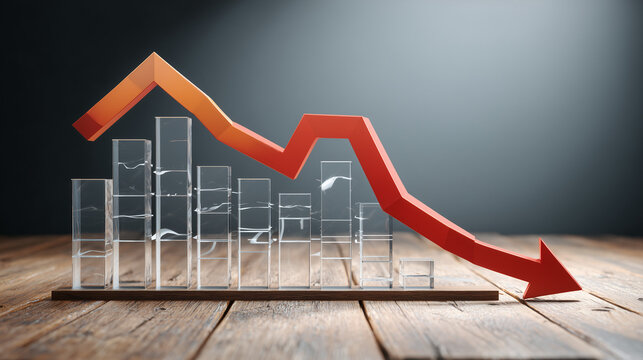
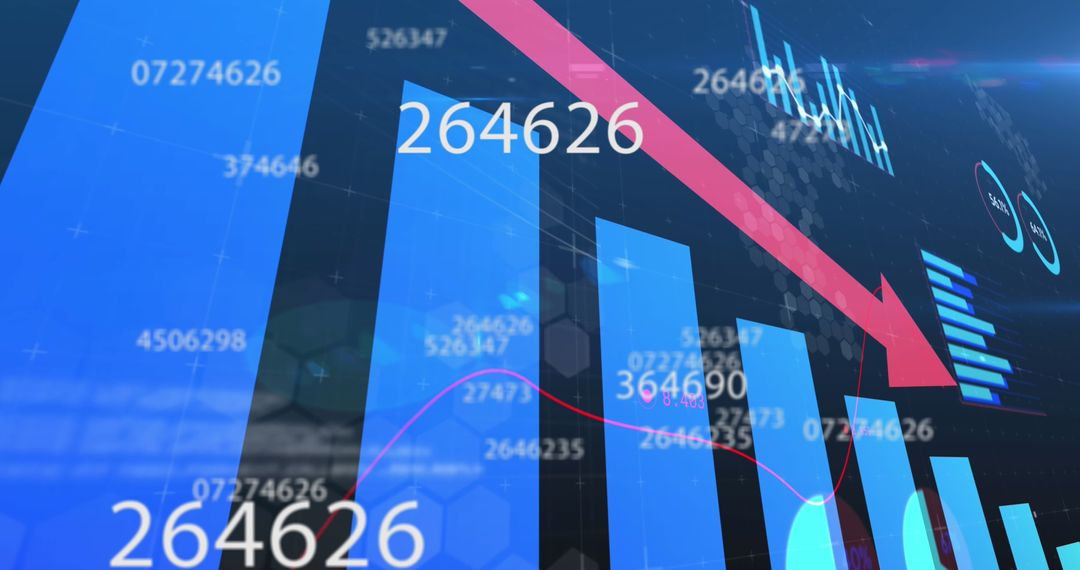
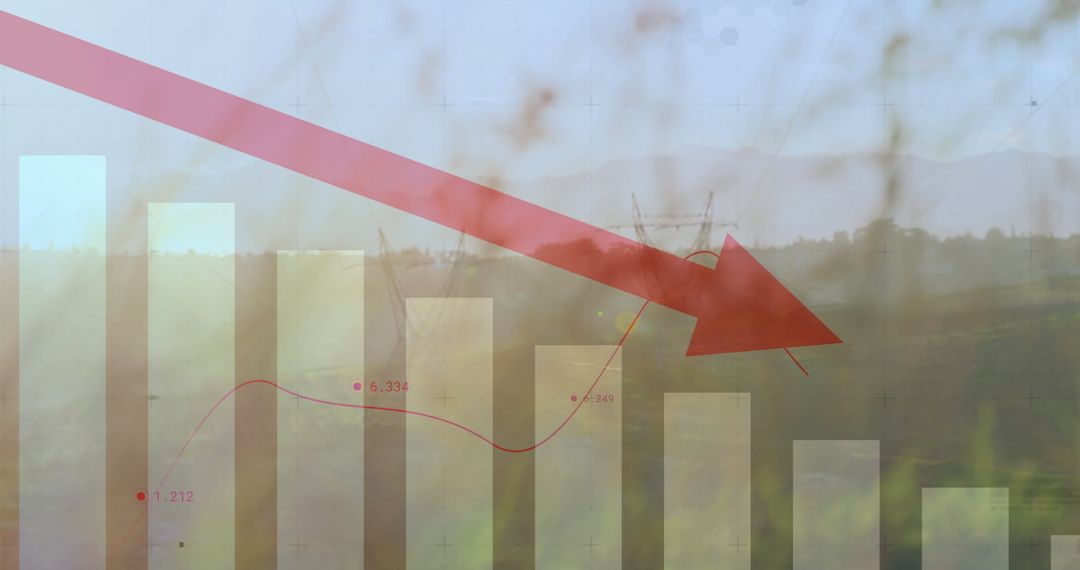
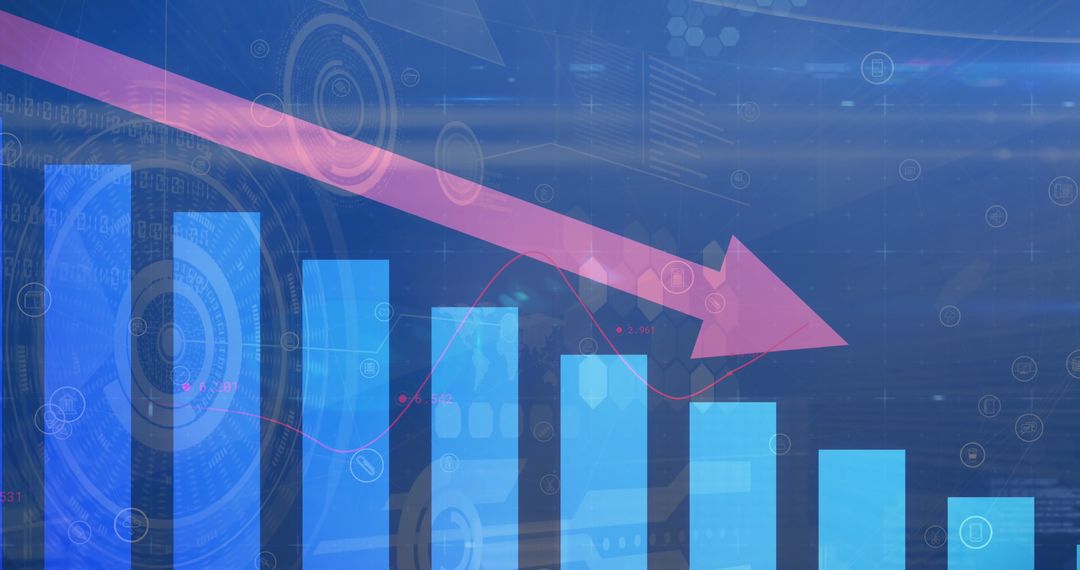
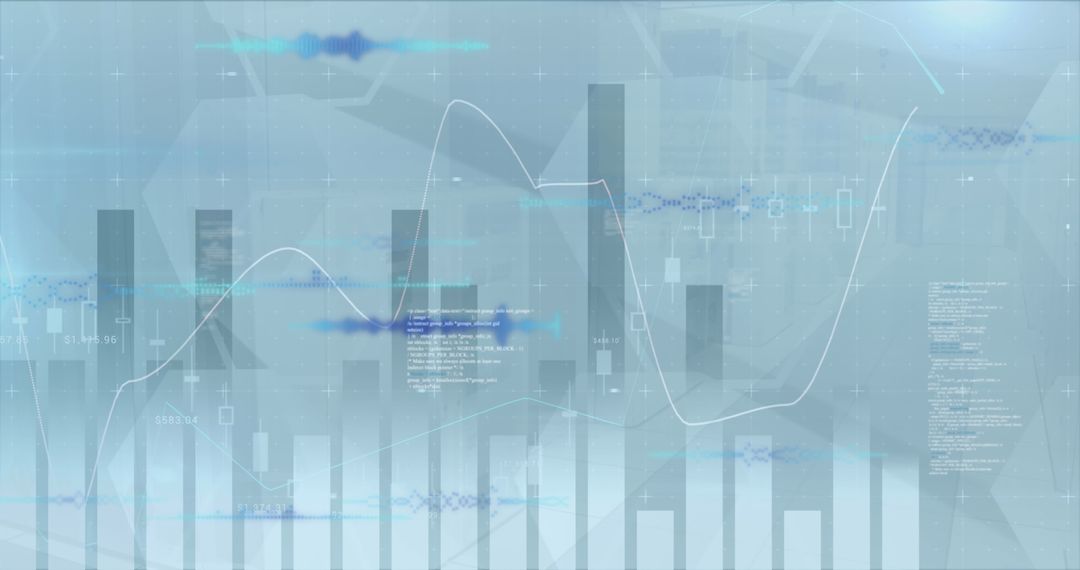
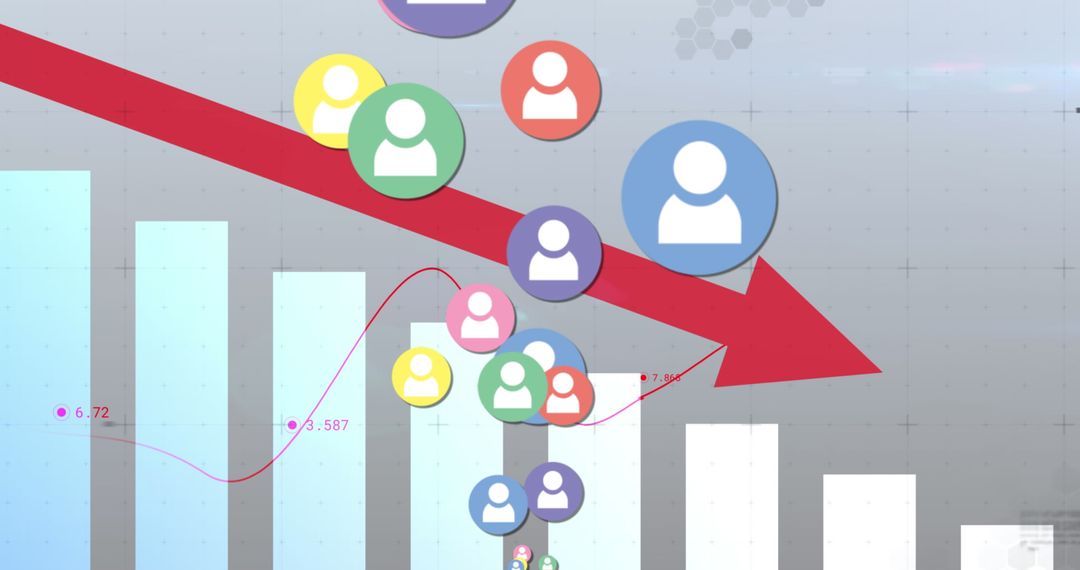
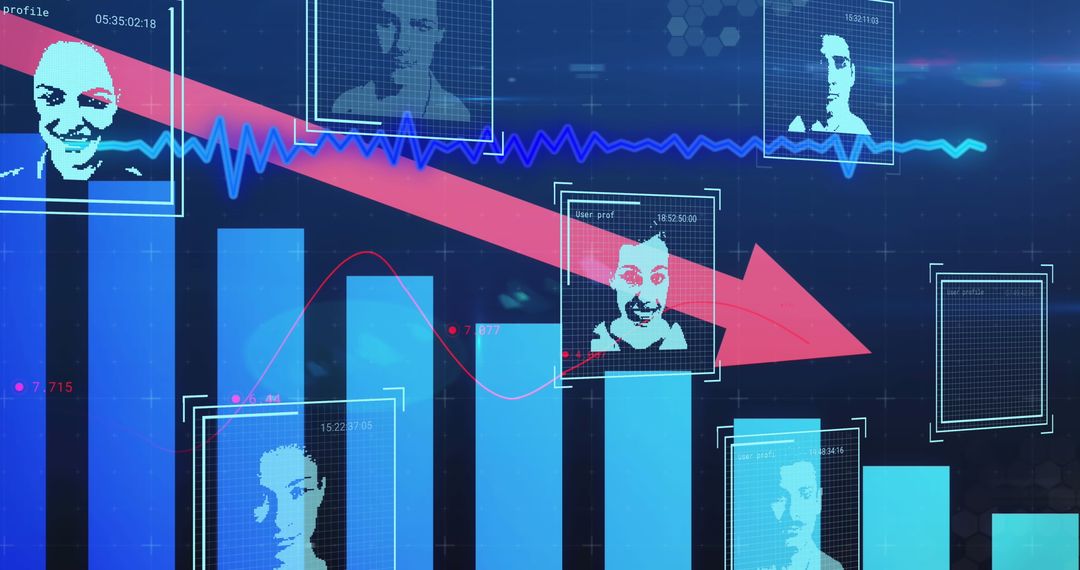
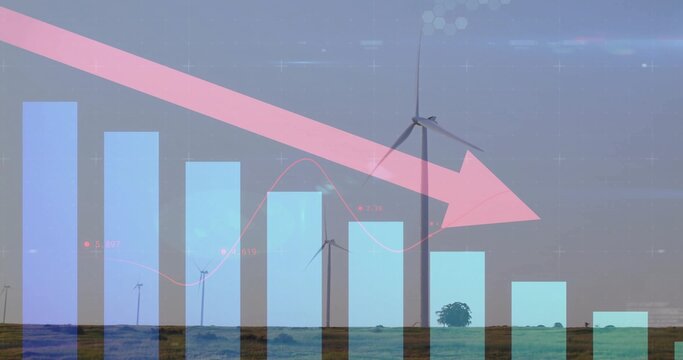
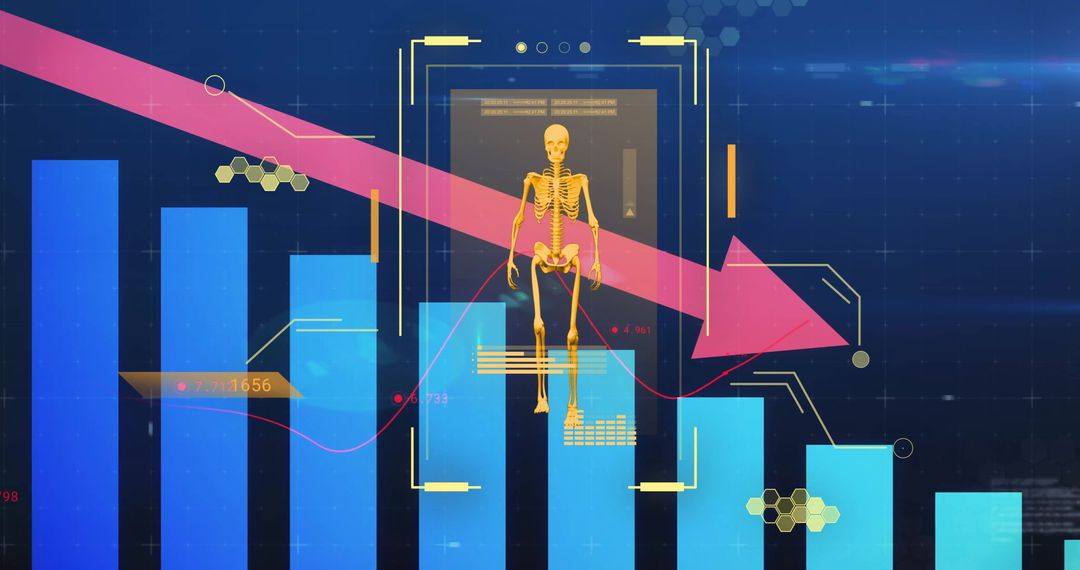
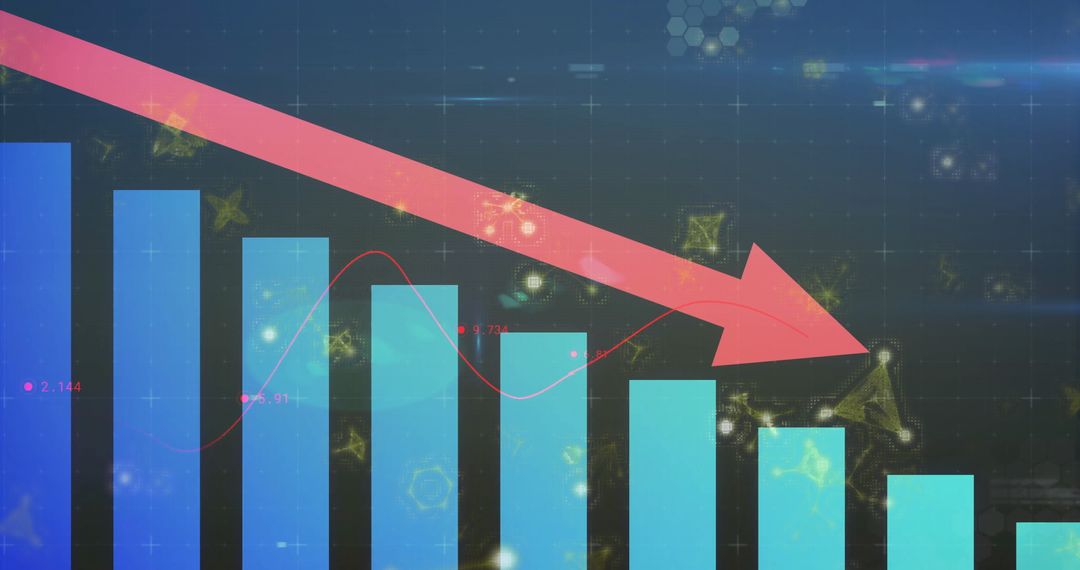
- Global Data Analytics and Trend Showing Decline with Bar Graph and Red Arrow
Global Data Analytics and Trend Showing Decline with Bar Graph and Red Arrow Image
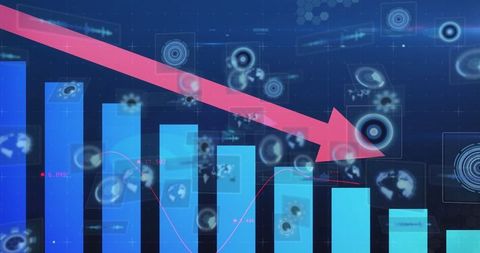
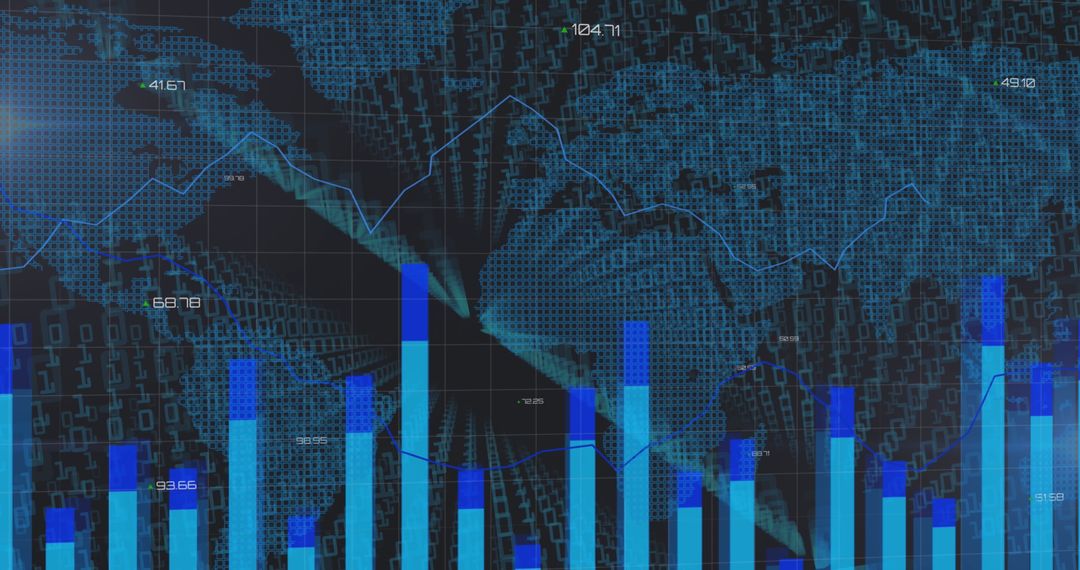
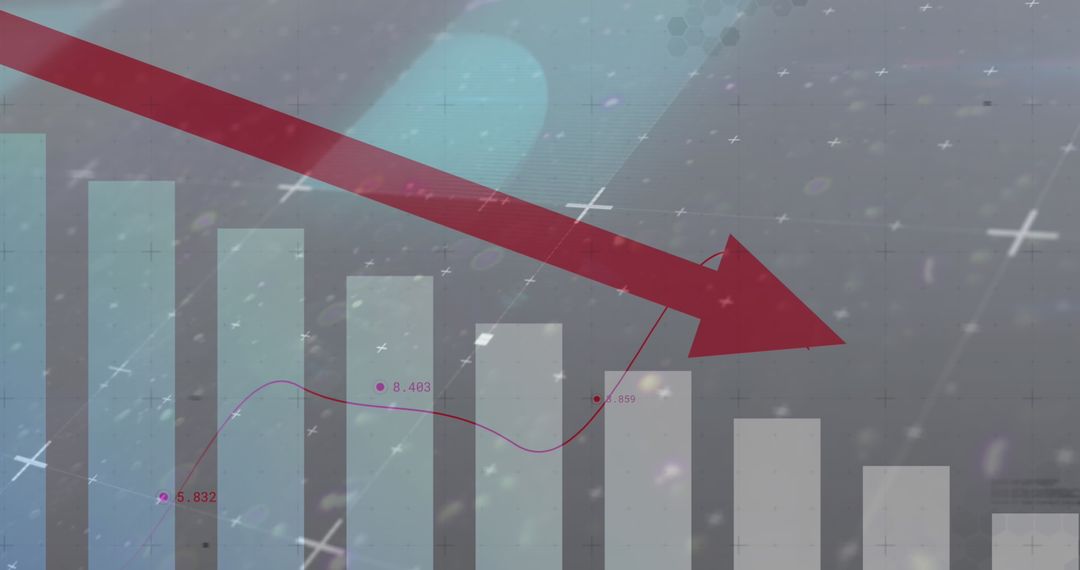
This image of a bar graph combined with a prominently placed red arrow represents a decline in data analytics or economic trends. Suitable for presentations or articles discussing market analysis, performance reviews, financial drops, economic forecasts, big data analytics, and technological impacts on data trends. The blue digital background indicates technological emphasis and scope scanning.
Powered by 


2
downloads
downloads
Tags:
More
Credit Photo
If you would like to credit the Photo, here are some ways you can do so
Text Link
photo Link
<span class="text-link">
<span>
<a target="_blank" href=https://pikwizard.com/photo/global-data-analytics-and-trend-showing-decline-with-bar-graph-and-red-arrow/12c5210ae6e4d6ef7df8f0c7df23b2da/>PikWizard</a>
</span>
</span>
<span class="image-link">
<span
style="margin: 0 0 20px 0; display: inline-block; vertical-align: middle; width: 100%;"
>
<a
target="_blank"
href="https://pikwizard.com/photo/global-data-analytics-and-trend-showing-decline-with-bar-graph-and-red-arrow/12c5210ae6e4d6ef7df8f0c7df23b2da/"
style="text-decoration: none; font-size: 10px; margin: 0;"
>
<img src="https://pikwizard.com/pw/medium/12c5210ae6e4d6ef7df8f0c7df23b2da.jpg" style="margin: 0; width: 100%;" alt="" />
<p style="font-size: 12px; margin: 0;">PikWizard</p>
</a>
</span>
</span>
Free (free of charge)
Free for personal and commercial use.
Author: People Creations
Similar Free Stock Images

Premium


Premium


Premium


Premium


Premium


Premium


Premium


Premium


Premium


Premium


Premium


Premium


Premium


Premium


Premium


Premium


Premium


Premium


Premium


Premium


Premium


Premium


Premium


Premium