
- Home >
- Stock Photos >
- Global Data Analytics Dashboard with Bar Graph and World Map
Global Data Analytics Dashboard with Bar Graph and World Map Image
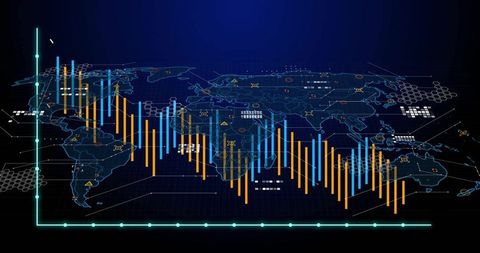
Comprehensive visualization showcasing interaction between global data trends and geographic locations. Useful for digital presentations discussing international trade, financial analysis, or business strategy. Great for marketing materials highlighting innovative solutions in data analysis or futuristic finance technologies.
Powered by 


downloads
Tags:
More
Credit Photo
If you would like to credit the Photo, here are some ways you can do so
Text Link
photo Link
<span class="text-link">
<span>
<a target="_blank" href=https://pikwizard.com/photo/global-data-analytics-dashboard-with-bar-graph-and-world-map/91713b4259b443ec71c0bd7ecd021fa2/>PikWizard</a>
</span>
</span>
<span class="image-link">
<span
style="margin: 0 0 20px 0; display: inline-block; vertical-align: middle; width: 100%;"
>
<a
target="_blank"
href="https://pikwizard.com/photo/global-data-analytics-dashboard-with-bar-graph-and-world-map/91713b4259b443ec71c0bd7ecd021fa2/"
style="text-decoration: none; font-size: 10px; margin: 0;"
>
<img src="https://pikwizard.com/pw/medium/91713b4259b443ec71c0bd7ecd021fa2.jpg" style="margin: 0; width: 100%;" alt="" />
<p style="font-size: 12px; margin: 0;">PikWizard</p>
</a>
</span>
</span>
Free (free of charge)
Free for personal and commercial use.
Author: People Creations