
- Home >
- Stock Photos >
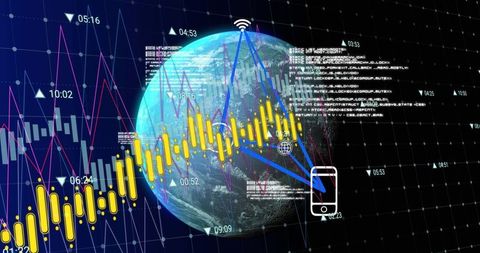
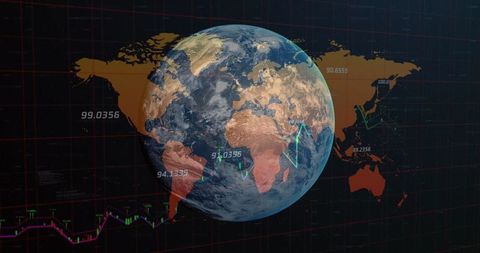
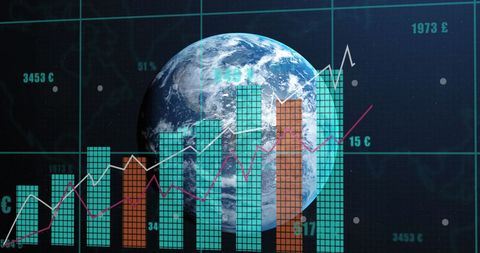
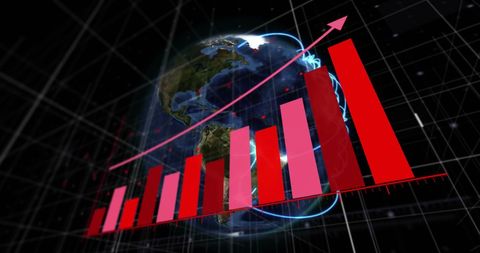
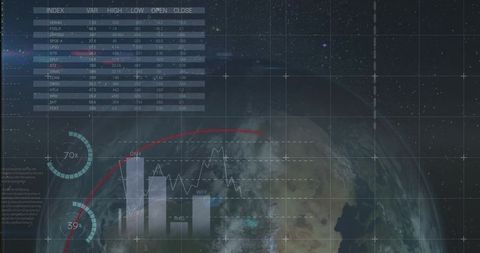
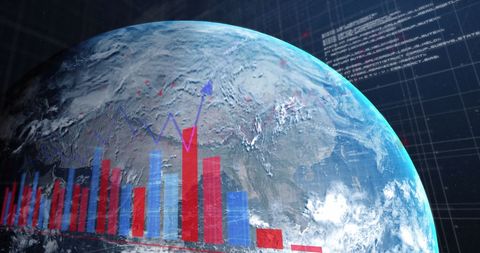
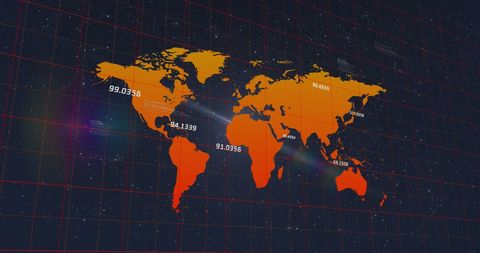
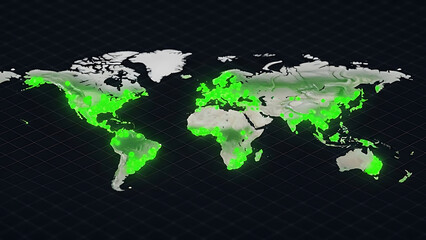
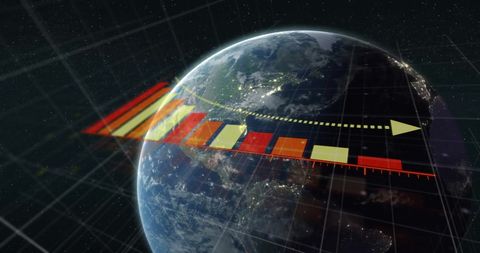
- Global Data Analytics Display with Holographic Charts
Global Data Analytics Display with Holographic Charts Image

A digitally generated image featuring a rotating globe with overlaid holographic charts and computer code against a dark background. This visual represents the intersection of global data analytics and advanced technology, showcasing trends, reports, and coding. Ideal for use in presentations, articles, or websites focusing on technology, global business trends, or data analysis and reports.
Powered by 


downloads
Tags:
More
Credit Photo
If you would like to credit the Photo, here are some ways you can do so
Text Link
photo Link
<span class="text-link">
<span>
<a target="_blank" href=https://pikwizard.com/photo/global-data-analytics-display-with-holographic-charts/c4b95e6bd7abe0f3122e689f9b00a7c8/>PikWizard</a>
</span>
</span>
<span class="image-link">
<span
style="margin: 0 0 20px 0; display: inline-block; vertical-align: middle; width: 100%;"
>
<a
target="_blank"
href="https://pikwizard.com/photo/global-data-analytics-display-with-holographic-charts/c4b95e6bd7abe0f3122e689f9b00a7c8/"
style="text-decoration: none; font-size: 10px; margin: 0;"
>
<img src="https://pikwizard.com/pw/medium/c4b95e6bd7abe0f3122e689f9b00a7c8.jpg" style="margin: 0; width: 100%;" alt="" />
<p style="font-size: 12px; margin: 0;">PikWizard</p>
</a>
</span>
</span>
Free (free of charge)
Free for personal and commercial use.
Author: Awesome Content
Similar Free Stock Images

Premium


Premium


Premium


Premium


Premium


Premium


Premium


Premium


Premium

Premium


Premium


Premium


Premium

Premium


Premium


Premium


Premium


Premium


Premium


Premium

Premium


Premium


Premium


Premium
Premium


Explore More Free Stock Images