
- Home >
- Stock Photos >
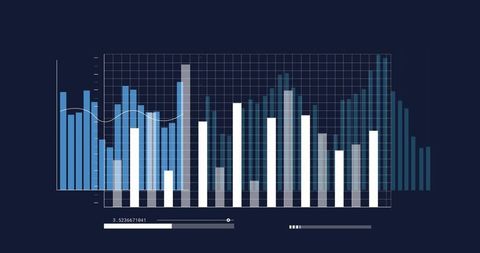
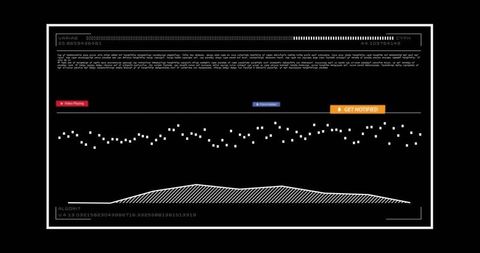
- Global Data Analytics Interface with Chart and Map on Digital Dashboard
Global Data Analytics Interface with Chart and Map on Digital Dashboard Image

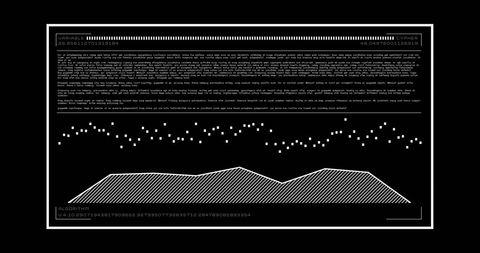
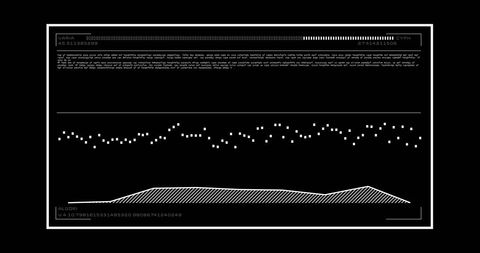
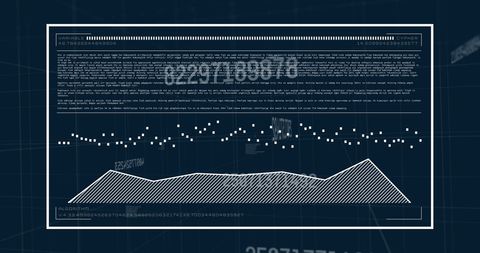
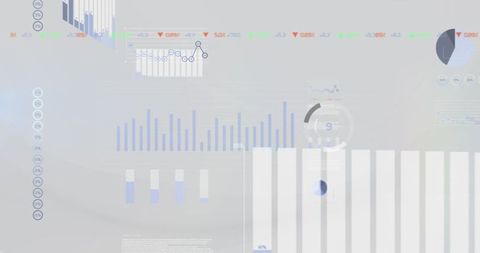
This abstract digital visualization features an advanced dashboard with an emphasis on global data analytics. A precise bar chart and detailed world map are the central focus, overlaid with code and a progress bar, offering both style and functionality. Ideal for illustrating technology themes, data-driven presentations, corporate videos, and fintech applications.
Powered by 


downloads
Tags:
More
Credit Photo
If you would like to credit the Photo, here are some ways you can do so
Text Link
photo Link
<span class="text-link">
<span>
<a target="_blank" href=https://pikwizard.com/photo/global-data-analytics-interface-with-chart-and-map-on-digital-dashboard/18b7f5c93ec61dfa90d5b2883702c46c/>PikWizard</a>
</span>
</span>
<span class="image-link">
<span
style="margin: 0 0 20px 0; display: inline-block; vertical-align: middle; width: 100%;"
>
<a
target="_blank"
href="https://pikwizard.com/photo/global-data-analytics-interface-with-chart-and-map-on-digital-dashboard/18b7f5c93ec61dfa90d5b2883702c46c/"
style="text-decoration: none; font-size: 10px; margin: 0;"
>
<img src="https://pikwizard.com/pw/medium/18b7f5c93ec61dfa90d5b2883702c46c.jpg" style="margin: 0; width: 100%;" alt="" />
<p style="font-size: 12px; margin: 0;">PikWizard</p>
</a>
</span>
</span>
Free (free of charge)
Free for personal and commercial use.
Author: Awesome Content
Similar Free Stock Images
Premium


Premium


Premium


Premium

Premium


Premium


Premium


Premium


Premium

Premium


Premium

Premium


Premium

Premium


Premium


Premium


Premium


Premium


Premium


Premium


Premium


Premium

Premium


Premium


Premium


Explore More Free Stock Images