
- Home >
- Stock Photos >
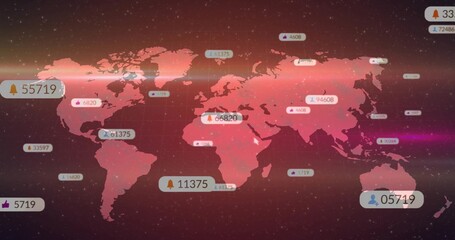
- Global Data Analytics Over World Map with Numeric Statistics
Global Data Analytics Over World Map with Numeric Statistics Image

The image presents a modern depiction of global data analytics with a composite world map backdrop. Overlaid with dotted lines and numerical statistics, it is ideal for scenarios related to big data, technology ventures, or presentations on global information networks. Useful for slideshows, website graphics, or online content focusing on data analysis and technological advancements.
Powered by 


downloads
Tags:
More
Credit Photo
If you would like to credit the Photo, here are some ways you can do so
Text Link
photo Link
<span class="text-link">
<span>
<a target="_blank" href=https://pikwizard.com/photo/global-data-analytics-over-world-map-with-numeric-statistics/4982589e0471d8f383fc17356f6d78bc/>PikWizard</a>
</span>
</span>
<span class="image-link">
<span
style="margin: 0 0 20px 0; display: inline-block; vertical-align: middle; width: 100%;"
>
<a
target="_blank"
href="https://pikwizard.com/photo/global-data-analytics-over-world-map-with-numeric-statistics/4982589e0471d8f383fc17356f6d78bc/"
style="text-decoration: none; font-size: 10px; margin: 0;"
>
<img src="https://pikwizard.com/pw/medium/4982589e0471d8f383fc17356f6d78bc.jpg" style="margin: 0; width: 100%;" alt="" />
<p style="font-size: 12px; margin: 0;">PikWizard</p>
</a>
</span>
</span>
Free (free of charge)
Free for personal and commercial use.
Author: Creative Art
Similar Free Stock Images

Premium


Premium


Premium


Premium


Premium


Premium


Premium

Premium


Premium


Premium

Premium


Premium


Premium


Premium


Premium


Premium


Premium


Premium


Premium


Premium


Premium


Premium


Premium


Premium


Premium

Explore More Free Stock Images