
- Home >
- Stock Photos >
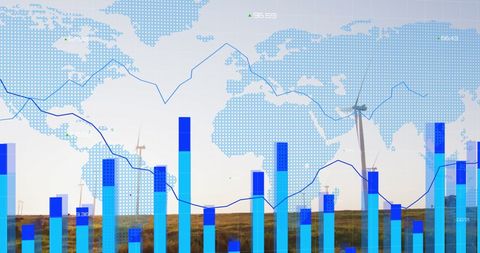
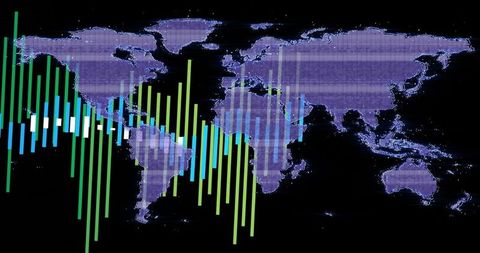
- Global Data Analytics Visualized on World Map Interface
Global Data Analytics Visualized on World Map Interface Image

Visual depicting global data analytics using bar and line graphs overlaid on a world map. Perfect for illustrating concepts in global business operations, finance, and technology. Suitable for use in presentations, reports, and marketing materials focused on data-driven strategies and international market insights.
Powered by  - Get 15% off with code: PIKWIZARD15


downloads
Tags:
More
Credit Photo
If you would like to credit the Photo, here are some ways you can do so
Text Link
photo Link
<span class="text-link">
<span>
<a target="_blank" href=https://pikwizard.com/photo/global-data-analytics-visualized-on-world-map-interface/8efdf1cec8ac9fcdd8e69b1904dfc9d2/>PikWizard</a>
</span>
</span>
<span class="image-link">
<span
style="margin: 0 0 20px 0; display: inline-block; vertical-align: middle; width: 100%;"
>
<a
target="_blank"
href="https://pikwizard.com/photo/global-data-analytics-visualized-on-world-map-interface/8efdf1cec8ac9fcdd8e69b1904dfc9d2/"
style="text-decoration: none; font-size: 10px; margin: 0;"
>
<img src="https://pikwizard.com/pw/medium/8efdf1cec8ac9fcdd8e69b1904dfc9d2.jpg" style="margin: 0; width: 100%;" alt="" />
<p style="font-size: 12px; margin: 0;">PikWizard</p>
</a>
</span>
</span>
Free (free of charge)
Free for personal and commercial use.
Author: Authentic Images
Similar Free Stock Images

Premium


Premium

Premium


Premium


Premium


Premium


Premium

Premium


Premium


Premium

Premium


Premium


Premium


Premium

Premium


Premium


Premium


Premium


Premium


Premium


Premium


Premium


Premium

Premium


Premium


Explore More Free Stock Images