
- Home >
- Stock Photos >
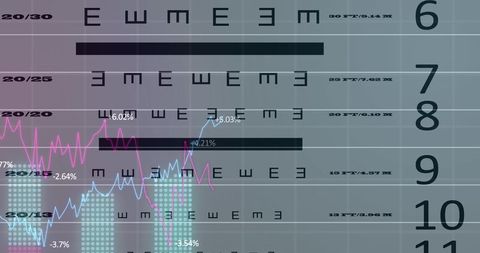
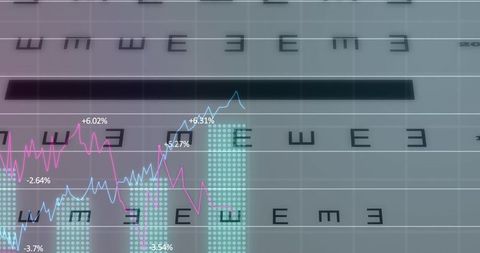
- Global Data Processing and Interface Concept with Charts
Global Data Processing and Interface Concept with Charts Image

Visual juxtaposition of alphanumeric characters with digital charts and world map illustrating concept of global data processing and financial analysis. Suitable for discussions on international trade, economic forecasts, fintech developments, business intelligence.
Powered by 


downloads
Tags:
More
Credit Photo
If you would like to credit the Photo, here are some ways you can do so
Text Link
photo Link
<span class="text-link">
<span>
<a target="_blank" href=https://pikwizard.com/photo/global-data-processing-and-interface-concept-with-charts/7beb13c85917165f39b0a8cf311a2886/>PikWizard</a>
</span>
</span>
<span class="image-link">
<span
style="margin: 0 0 20px 0; display: inline-block; vertical-align: middle; width: 100%;"
>
<a
target="_blank"
href="https://pikwizard.com/photo/global-data-processing-and-interface-concept-with-charts/7beb13c85917165f39b0a8cf311a2886/"
style="text-decoration: none; font-size: 10px; margin: 0;"
>
<img src="https://pikwizard.com/pw/medium/7beb13c85917165f39b0a8cf311a2886.jpg" style="margin: 0; width: 100%;" alt="" />
<p style="font-size: 12px; margin: 0;">PikWizard</p>
</a>
</span>
</span>
Free (free of charge)
Free for personal and commercial use.
Author: Creative Art
Similar Free Stock Images

Premium


Premium

Premium


Premium


Premium


Premium


Premium


Premium


Premium


Premium

Premium


Premium


Premium


Premium


Premium


Premium


Premium


Premium


Premium


Premium

Premium

Premium


Premium


Premium


Premium


Explore More Free Stock Images