
- Home >
- Stock Photos >
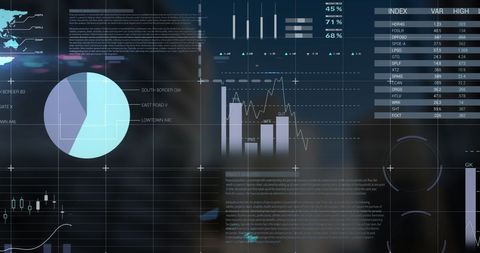
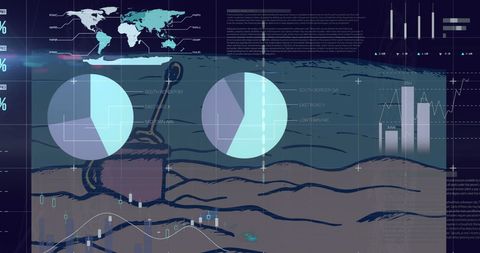
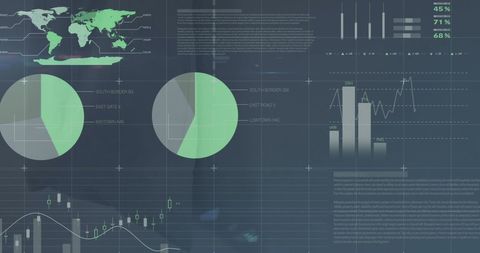
- Global Data Processing Interface with Graphs and Charts
Global Data Processing Interface with Graphs and Charts Image

Various visualizations including pie charts, bar graphs, and world map over a dark background create a futuristic data processing interface. Vital for illustrating concepts of business intelligence and analytics, this digital image suits academic publications, tech-related articles, and presentations on global business strategies.
Powered by  - Get 15% off with code: PIKWIZARD15


downloads
Tags:
More
Credit Photo
If you would like to credit the Photo, here are some ways you can do so
Text Link
photo Link
<span class="text-link">
<span>
<a target="_blank" href=https://pikwizard.com/photo/global-data-processing-interface-with-graphs-and-charts/75bb228ca836493dbc170ed8d686cc82/>PikWizard</a>
</span>
</span>
<span class="image-link">
<span
style="margin: 0 0 20px 0; display: inline-block; vertical-align: middle; width: 100%;"
>
<a
target="_blank"
href="https://pikwizard.com/photo/global-data-processing-interface-with-graphs-and-charts/75bb228ca836493dbc170ed8d686cc82/"
style="text-decoration: none; font-size: 10px; margin: 0;"
>
<img src="https://pikwizard.com/pw/medium/75bb228ca836493dbc170ed8d686cc82.jpg" style="margin: 0; width: 100%;" alt="" />
<p style="font-size: 12px; margin: 0;">PikWizard</p>
</a>
</span>
</span>
Free (free of charge)
Free for personal and commercial use.
Author: Creative Art
Similar Free Stock Images

Premium


Premium

Premium


Premium


Premium


Premium


Premium


Premium

Premium

Premium

Premium


Premium


Premium


Premium


Premium


Premium


Premium


Premium


Premium


Premium


Premium

Premium


Premium


Premium


Premium


Explore More Free Stock Images