1. Home > 
  2. Stock Photos > 
  3. Global Data Processing Over Interactive World Map

Global Data Processing Over Interactive World Map Image

Global Data Processing Over Interactive World Map

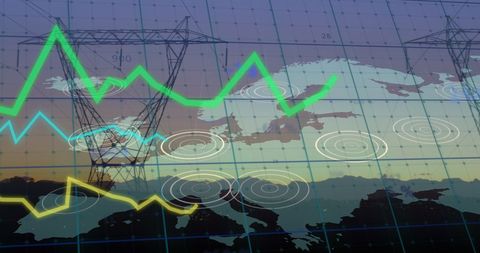
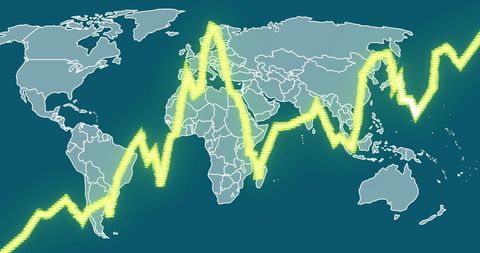
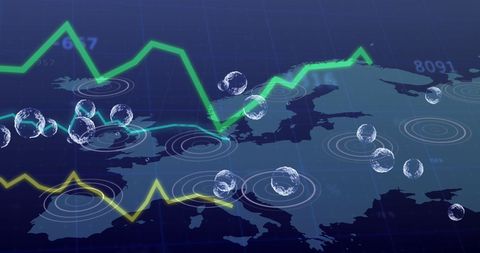
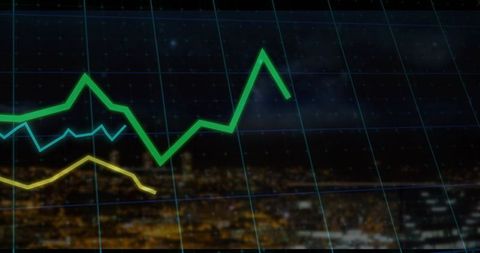
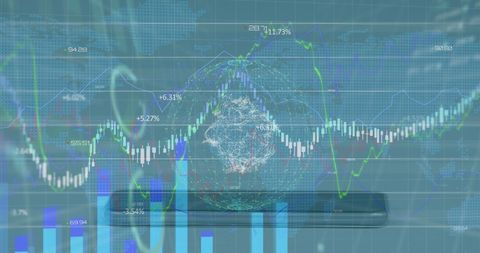
This visual depicts digital data processing and analysis, superimposed on a world map symbolizing global business connections and financial trends. Suitable for presentations on technology, economical data strategies, and international market strategy discussions.

Powered by Adobe logo
Global network of servers in a data center - Powered by AdobeA diverse team of professionals engaging in a collaborative meeting focused on data analysis and artificial intelligence strategies inside a modern office setting. Trope - Powered by AdobeIT Professional Monitoring World Map Data in HighTech Control Room  Security. - Powered by AdobeBusinessman's finger touching glowing point on futuristic digital world map interface, for global market strategy, international data connection, network expansion, worldwide business - Powered by AdobeData visualization dashboard displaying complex analytics, global map, and charts, in a modern dark mode interface for business intelligence. - Powered by Adobe

Credit Photo

If you would like to credit the Photo, here are some ways you can do so

Free (free of charge)

Free for personal and commercial use.

Author: Awesome Content

Similar Free Stock Images

Futuristic Data Analysis Overlaying Cityscape Digital Interface
Premium
Ai network management in a data center with world map hologram and interconnected lines. Smart technology for global data processing and internet connectivity.
Displaying Holographic 3D Red Bar Chart Tracing Red-Orange Line Graph on Analytics HUD
Premium
A businessman using AI technology to manage global human data, showing an artificial intelligence interface and digital network for business and recruitment strategy.
Global Data Visualization with Neon Financial Trends
Global Business Data and Analytics on Digital Map Background
Abstract Financial Data Diagrams Overlapping Sea Waves
Premium
Exploring the interconnectedness of global industries through a digital world map and network visualization
Premium
World map with glowing lines representing international connections. An abstraction of a global worldwide telecommunications network with nodes connected all over the Earth, AI Generated
Premium
Double exposure of abstract digital world map on blurry metal background, research and strategy concept
Rising Graphs Over Cityscape Illustrating Financial Growth
Rising Financial Data Highlights Global Economic Growth
Data Processing Interface with Analytic Visuals on World Map
Rising Graph with Data and Analysis Objects on Blue Background
Premium
Businessman hands typing on laptop with holographic global data analytics dashboard, world map visualization and business intelligence charts floating above keyboard
Dynamic Stock Market Data and Cityscape Background
Futuristic Data Visualization with Teal Grid Interface and Waveform Lines
Futuristic Financial Chart Data Analysis with Blue Bar Graph
Illuminated Financial Data Chart Display on Dark Backdrop
Premium
Automated document processing with robotic hand for streamlined workflows and digital transformation solutions
Digital DNA Strand Over Global Map Representing Data Transmission
Abstract Financial Data Graphics Illustrating Analysis
Dynamic Financial Data Visual Display with Graph Annotations
Financial Analytics Chart in Digital Interface Design
Global Financial Trends with Bright Yellow Line On World Map
Premium
A businessman contemplating the complex global logistics network and supply chain optimization.
Digital Financial Data Analysis with Chart and Markers
Global Financial Data Analysis on Digital World Map Background
Data Processing Overlay on Map of Europe Financial Concept
Global Network Connections on Digital Blue Background
Premium
Global data network visualization, digital map with glowing lines
Abstract Financial Graphs and Data Over Cityscape
Dynamic Financial Data Analyzing with Graph Overlays
Global Financial Data Interface with Rotating Globe Overlay
Global Financial Data Visualization on World Map Design
Global Economic Downturn with Digital Interface
Colorful Stock Market Graph on World Map Background
Premium
Modern futuristic interface showcasing global data analysis and business insights
Financial Growth Chart with Digital Data Interface
Dynamic Financial Growth Graph on Blue Grid Background
Green Line Graph Overlaid on Empty Office with Data Overlay
Dynamic Financial Graphs with Cityscape Background
Dynamic Financial Data Charts on Dark Digital Background
Global Financial Data Visualization with Digital Overlays
Premium
Futuristic glowing geometric shapes representing advanced digital technology, data processing, and virtual systems
Blurred Office Scene Featuring Digital Financial Data Projections
Global Networking and Data Visualization Over Stormy Sky
Global Economic Trends Overlaid on World Map
Premium
Global network displaying glowing connections and lines across a digital earth, representing data flow, communication, and technological advancement in space
Premium
Person interacting with digital agile methodology flowchart on laptop screen hand technology
Global Financial Data and Market Analysis Concept
Global Data Projection Showing Stock Market Trends with Digital Globe
Dynamic Financial Market Trends with Data Visualizations
Red Financial Trendline in Digital Interface Background
Premium
Offshoring and global remote work. Cross-border collaboration system for skilled talent. Businessperson holding world map and people icons.
Digital World Map with Global Data Processing and Networks
Dynamic Financial Graph Analyzing Market Trends
Dynamic Data Charts on Geometric Abstract Background
Abstract Digital Finance Graph Interface Display
Global Financial Data Overlay on World Map for Business Analysis
Premium
Image of graphs, data and world map on black digital screen
Financial Graphs with Cityscape Background Reflecting Market Trends
Futuristic 3D Financial Dashboard Displaying Neon Cyan Orange Line Charts with Grid View
Declining Financial Graph with Urban Backdrop and Grid Overlay
Premium
SAP Systems, Applications and Products, enterprise software solutions concept. Globe surrounded by application icons, representing integrated business management systems & data processing capabilities
Futuristic Financial Graphs with Dynamic Green Line
Premium
Image of data processing and world map over caucasian man in server room
Green Financial Data Line Graph Over Cityscape Background
Digital Graph Showing Financial Fluctuations on Digital Grid Interface
European Stock Market Data Analysis
Futuristic Dashboard with Neon Line Graphs and Digital Interface
Financial Data Overlay on Office Computers
Financial Data Analysis with Vibrant Lines on Blue Background
Futuristic Business Data Graphs over City Skyline
Premium
Hands holding digital gears and network over world map
Neon Market Lines Rising and Falling Over Urban Skyline Overlay for Finance Analytics
Dynamic Financial Data Overlaying Urban Cityscape
Global Data Analytics and Business Growth Visualization
Dynamic Financial Graph with Global Data Overlay
Global Data Analysis with World Map and Pulse Wave
Futuristic Data Analysis with Digital Graphs on Gradient
Dynamic Data Visualization with Neon Line Graphs Against Cityscape
Digital Globe with Network Connections and Security Icons
Energy Grid with Data Overlay Reflecting Economic Trends in Europe
Premium
A persons finger touches the sap logo on a digital world map interface, symbolizing global business technology and data management
Digital Data Overlaid on Cityscape for Business Analysis
Dynamic Stock Market and Financial Data Analysis Concept
Dynamic Financial Data with Fluctuating Graph Lines
Futuristic Data Graphing Over Urban Cityscape
Premium
Global data file sharing network showing folders connected over a digital world map, and secure communication. Technology big data digital background. 3d rendering
Candlestick and line market chart visualizing stock performance with percentage gain labels
Cityscape Blended with Graphs Showing Finance Trends
Global Finance Technology Vision over Digital Map
Financial Data on USA Flag Background Symbolizing Economics
Financial Data Visualization with Dynamic Graphical Analysis
Global Data Connections on Digital Interface Display
Financial Trends with Power Line Graphic Overlay
Financial Data Graph Over Urban Cityscape
Dynamic Graphs and Digital Networks Overlay
Innovative Data Analysis over DNA Strand
Global Business Data Analytics on Smartphone
Financial Graphs Overlaying Cityscape Illustrate Global Economy
Financial Data Graph Overlay on Modern Office Background
Financial Growth Data Overlay on Urban Skyline
Premium
Global digital transformation concept with world map on a processor for modern technology
Abstract Financial Graph Displayed on Office Monitor
Global Financial Data Trends on World Map
Dynamic Financial Statistics with Cityscape Overlay
Global Data Visualization with Graph Overlay on World Map
Premium
Abstract world map background with white color blocks and gears symbolizing global networks and technology
Dynamic Stock Market Chart with Shoe Icons Overlay
Global Financial Graph Showing Decline Indicating Recession
Financial Market Chart on Digital Screen Showing Growing Trends
Digital Financial Graph Overlapping Modern Cityscape
Premium
This image showcases a futuristic data dashboard featuring various graphs and a world map overlaying a vibrant city skyline at night. Impute
Global Financial Data Trading Analytics Over Flames Concept
Futuristic Digital Dashboard with Neon Line Charts Analysis
Holographic Battery Icon Over Stock Market Trading Board
Premium
A person interacting with a virtual display showcasing the acronym NLP with a digital world map backdrop, representing natural language processing and global connectivity.
3D Green Line Chart Showing Market Volatility and Price Point 106.51 on Blue Grid
Holographic Neon Trend Lines Dashboard Showing Cyan and Orange Data Waves Over Grid
Financial Data Processing with Mathematical Formulae Interface
Premium
Effective Time Management Strategies Shown on World Map, Emphasizing Prioritization, Scheduling, and Efficiency for Global Productivity
Global Financial Data on Digital World Map for Analytics
Financial Data Analytics Over Changing Line Graphs
Explore More Free Stock Images