- Home >
- Stock Photos >
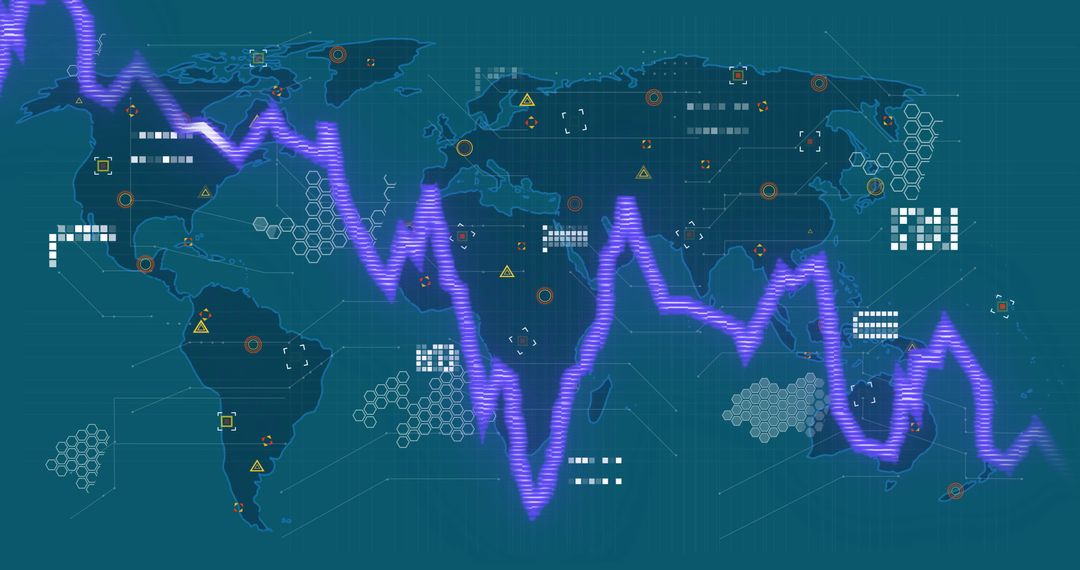
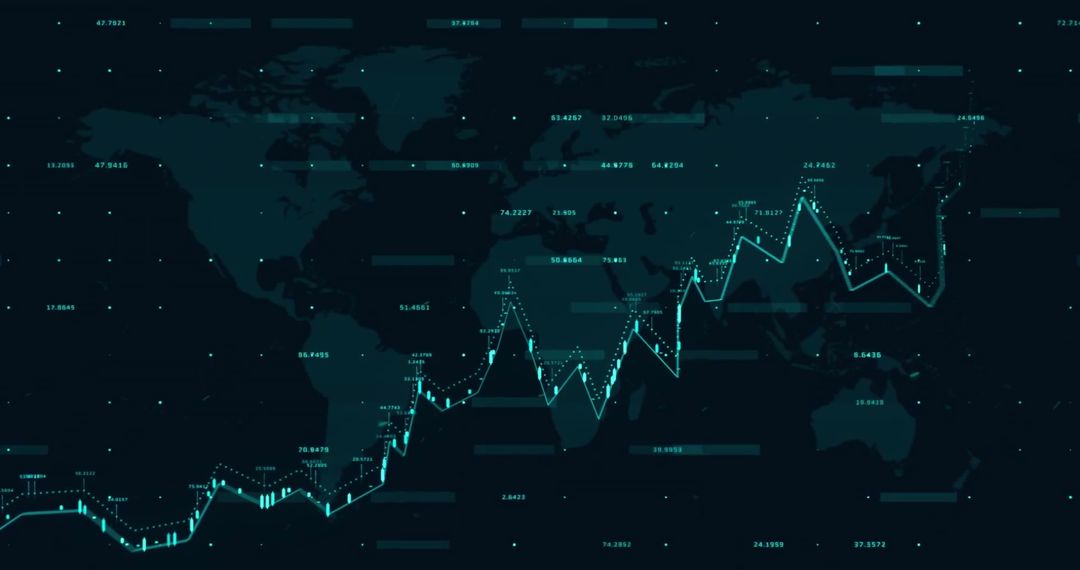
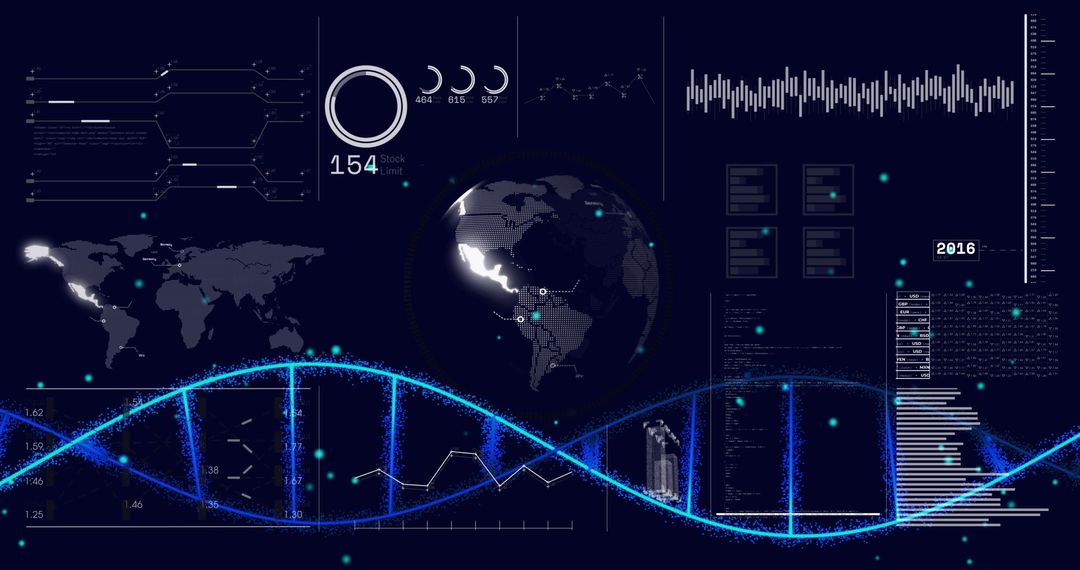
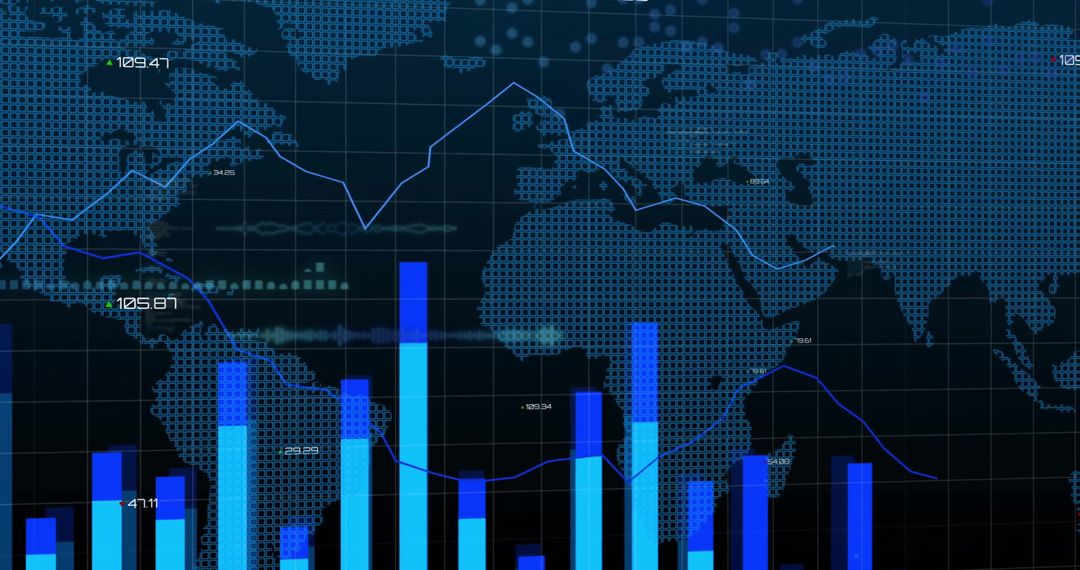
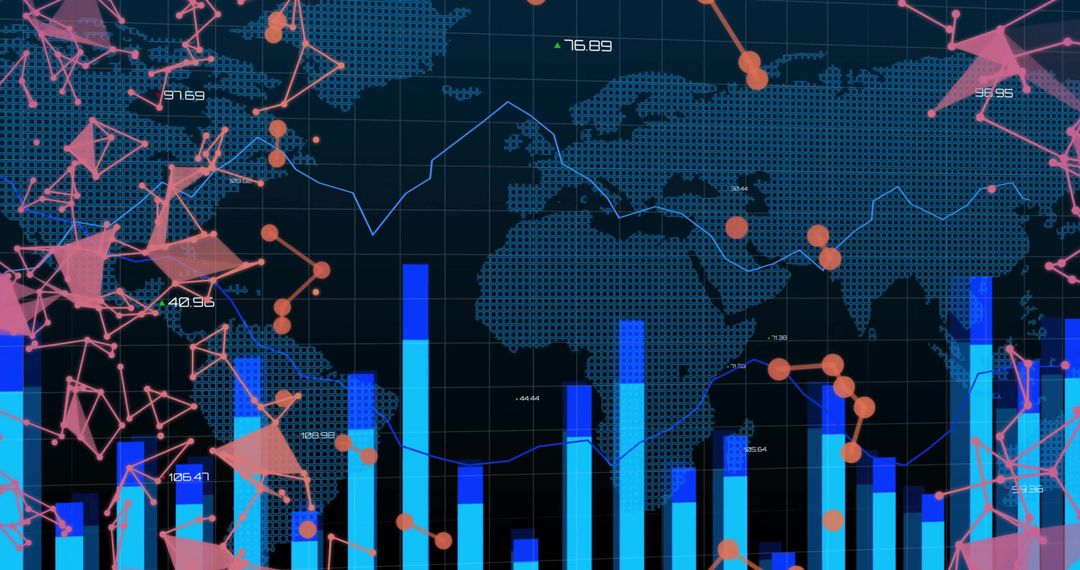
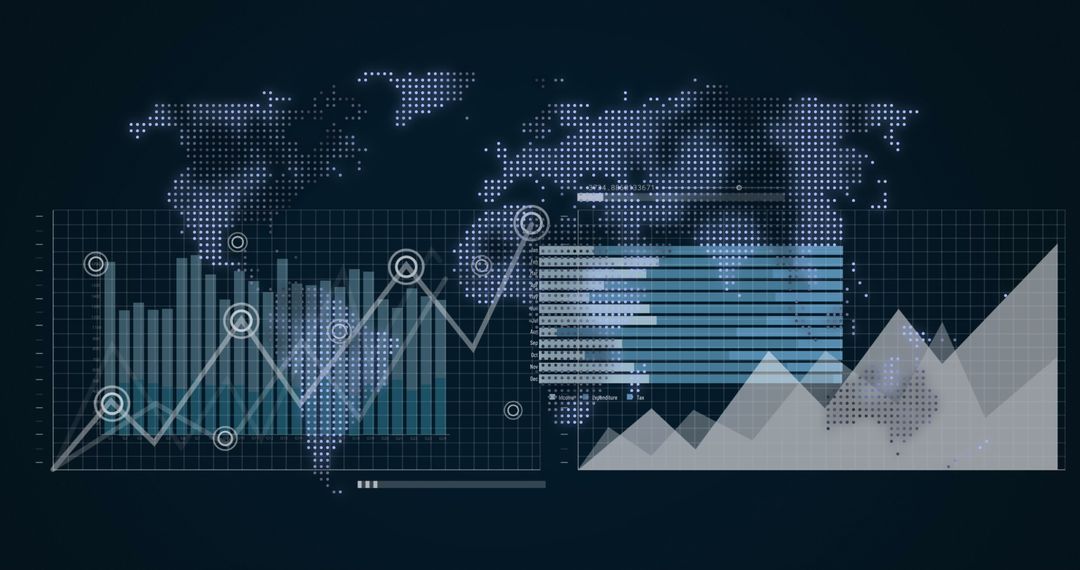
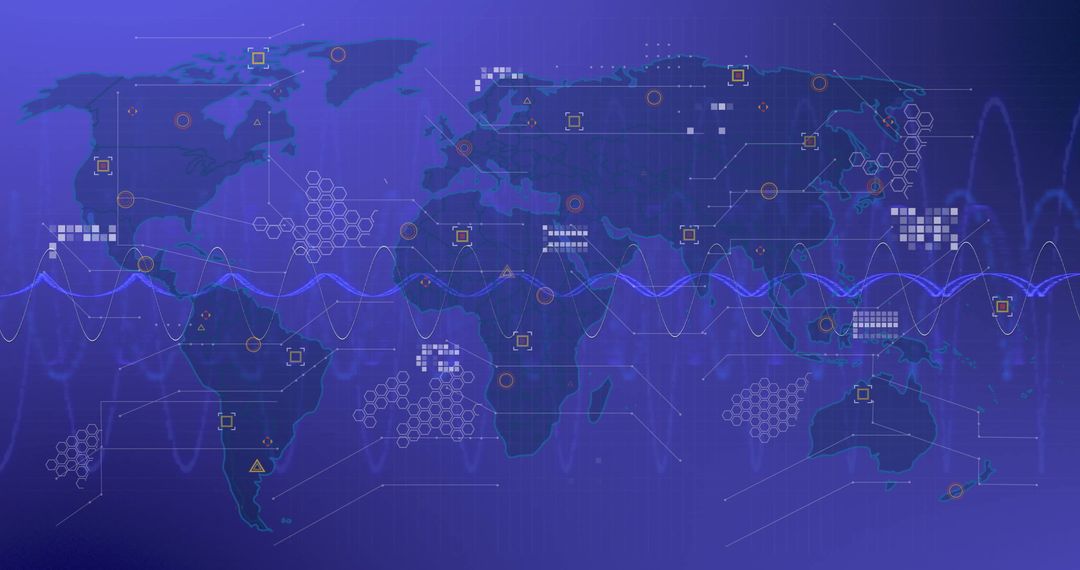
- Global Data Processing over World Map for Business Insights
Global Data Processing over World Map for Business Insights Image
Graphic representation of global data processing on a world map, showcasing concepts related to business and finance analytics. Suitable for illustrating global economic analysis, technological advancements in data calculation, or networking in business modules. Ideal for websites or presentations emphasizing technology's role in connecting worldwide economic trends.
Powered by  - Get 15% off with code: PIKWIZARD15


2
downloads
downloads
Tags:
More
Credit Photo
If you would like to credit the Photo, here are some ways you can do so
Text Link
photo Link
<span class="text-link">
<span>
<a target="_blank" href=https://pikwizard.com/photo/global-data-processing-over-world-map-for-business-insights/75f2451e349f748085c21a75a2d139fb/>PikWizard</a>
</span>
</span>
<span class="image-link">
<span
style="margin: 0 0 20px 0; display: inline-block; vertical-align: middle; width: 100%;"
>
<a
target="_blank"
href="https://pikwizard.com/photo/global-data-processing-over-world-map-for-business-insights/75f2451e349f748085c21a75a2d139fb/"
style="text-decoration: none; font-size: 10px; margin: 0;"
>
<img src="https://pikwizard.com/pw/medium/75f2451e349f748085c21a75a2d139fb.jpg" style="margin: 0; width: 100%;" alt="" />
<p style="font-size: 12px; margin: 0;">PikWizard</p>
</a>
</span>
</span>
Free (free of charge)
Free for personal and commercial use.
Author: Awesome Content
Similar Free Stock Images

Premium


Premium


Premium


Premium


Premium

Premium


Premium


Premium

Premium


Premium


Premium

Premium


Premium


Premium


Premium


Premium


Premium


Premium


Premium


Premium


Premium


Premium


Premium


Premium