
- Home >
- Stock Photos >
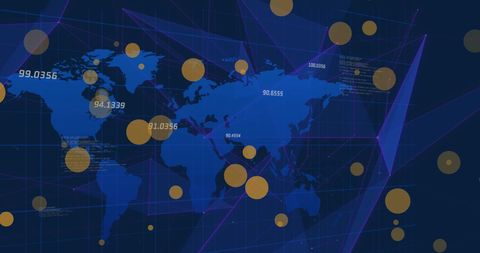
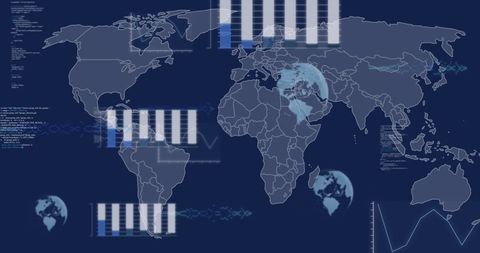
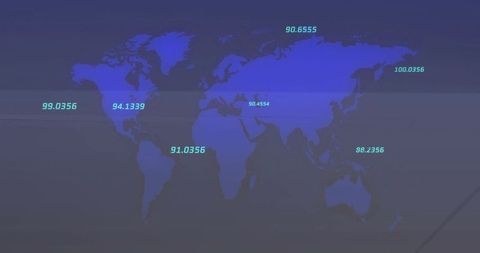
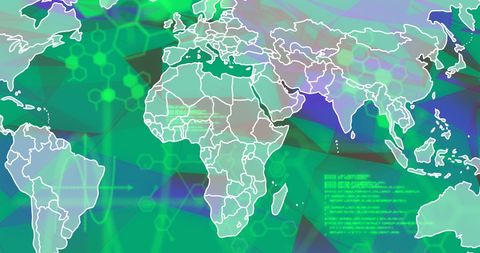
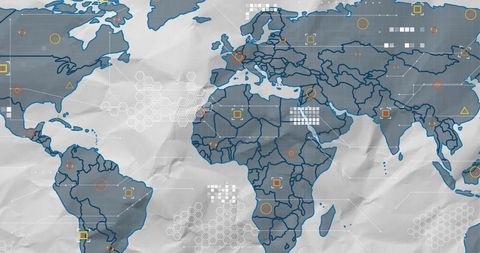
- Global Data Processing Over World Map with Infographics
Global Data Processing Over World Map with Infographics Image
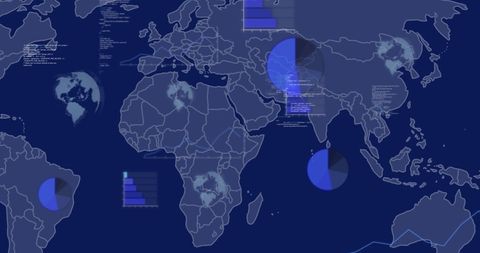
This digital compilation illustrates various infographics such as pie charts and bar diagrams superimposed on a world map, symbolizing global networking, data processing, and analytics. It is ideal for use in presentations or reports related to international business strategies, data science projects, and financial analytics. This imagery aids in demonstrating complex information and global data flows, as well as showcasing analyses of business integration across different regions.
Powered by 


downloads
Tags:
More
Credit Photo
If you would like to credit the Photo, here are some ways you can do so
Text Link
photo Link
<span class="text-link">
<span>
<a target="_blank" href=https://pikwizard.com/photo/global-data-processing-over-world-map-with-infographics/e3cda8ef00d35862777448d3e22ccd1a/>PikWizard</a>
</span>
</span>
<span class="image-link">
<span
style="margin: 0 0 20px 0; display: inline-block; vertical-align: middle; width: 100%;"
>
<a
target="_blank"
href="https://pikwizard.com/photo/global-data-processing-over-world-map-with-infographics/e3cda8ef00d35862777448d3e22ccd1a/"
style="text-decoration: none; font-size: 10px; margin: 0;"
>
<img src="https://pikwizard.com/pw/medium/e3cda8ef00d35862777448d3e22ccd1a.jpg" style="margin: 0; width: 100%;" alt="" />
<p style="font-size: 12px; margin: 0;">PikWizard</p>
</a>
</span>
</span>
Free (free of charge)
Free for personal and commercial use.
Author: Authentic Images
Similar Free Stock Images
AI


Premium


Premium


Premium


Premium


Premium


Premium


Premium


Premium

AI


Premium

Premium


Premium

Premium


Premium


Premium


Premium


Premium


Premium


Premium


Premium

Premium


Premium


Premium


Premium


Premium

Premium


Explore More Free Stock Images