
- Home >
- Stock Photos >
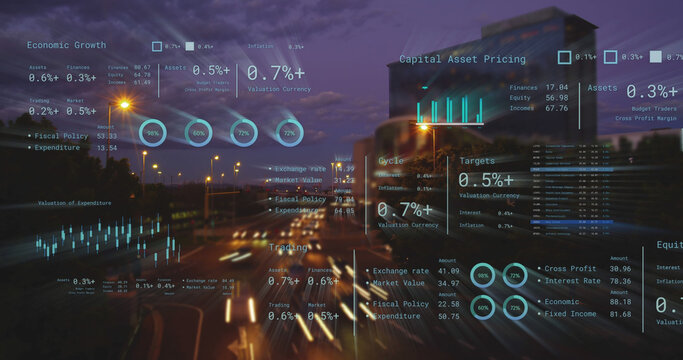
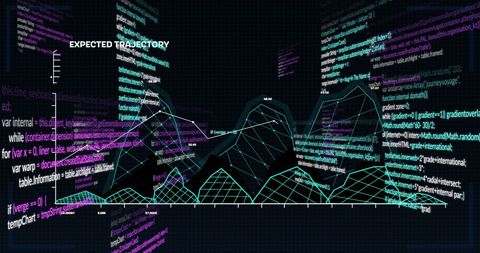
- Global Data Processing Visualization with Finance Metrics
Global Data Processing Visualization with Finance Metrics Image

This visual presents digital financial data processing over a graphic grid, combining global and numeric elements. Useful for illustrating subjects like global finance, data analytics, and cutting-edge technology in financial news, business presentations, and educational content about economic data management.
Powered by 


downloads
Tags:
More
Credit Photo
If you would like to credit the Photo, here are some ways you can do so
Text Link
photo Link
<span class="text-link">
<span>
<a target="_blank" href=https://pikwizard.com/photo/global-data-processing-visualization-with-finance-metrics/e085de1a12a2f8780aa22b8111d36220/>PikWizard</a>
</span>
</span>
<span class="image-link">
<span
style="margin: 0 0 20px 0; display: inline-block; vertical-align: middle; width: 100%;"
>
<a
target="_blank"
href="https://pikwizard.com/photo/global-data-processing-visualization-with-finance-metrics/e085de1a12a2f8780aa22b8111d36220/"
style="text-decoration: none; font-size: 10px; margin: 0;"
>
<img src="https://pikwizard.com/pw/medium/e085de1a12a2f8780aa22b8111d36220.jpg" style="margin: 0; width: 100%;" alt="" />
<p style="font-size: 12px; margin: 0;">PikWizard</p>
</a>
</span>
</span>
Free (free of charge)
Free for personal and commercial use.
Author: People Creations
Similar Free Stock Images

Premium

Premium

Premium


Premium


Premium


Premium


Premium


Premium


Premium

Premium

Premium


Premium


Premium


Premium


Premium


Premium


Premium


Premium


Premium


Premium


Premium


Premium


Premium

Premium


Premium

Explore More Free Stock Images