
- Home >
- Stock Photos >
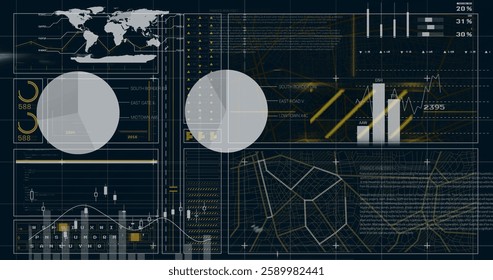
- Global Data Processing with Digital Analytics Over Globe
Global Data Processing with Digital Analytics Over Globe Image
Tech concept visually connects global data processing and statistics in a digital environment. Useful for representing industry reports, articles on data science, or illustrating advanced IT processes.
Powered by  - Get 15% off with code: PIKWIZARD15


downloads
Tags:
More
Credit Photo
If you would like to credit the Photo, here are some ways you can do so
Text Link
photo Link
<span class="text-link">
<span>
<a target="_blank" href=https://pikwizard.com/photo/global-data-processing-with-digital-analytics-over-globe/8973398f645e02ff12065c7572e0764d/>PikWizard</a>
</span>
</span>
<span class="image-link">
<span
style="margin: 0 0 20px 0; display: inline-block; vertical-align: middle; width: 100%;"
>
<a
target="_blank"
href="https://pikwizard.com/photo/global-data-processing-with-digital-analytics-over-globe/8973398f645e02ff12065c7572e0764d/"
style="text-decoration: none; font-size: 10px; margin: 0;"
>
<img src="https://pikwizard.com/pw/medium/8973398f645e02ff12065c7572e0764d.jpg" style="margin: 0; width: 100%;" alt="" />
<p style="font-size: 12px; margin: 0;">PikWizard</p>
</a>
</span>
</span>
Free (free of charge)
Free for personal and commercial use.
Author: Awesome Content
Similar Free Stock Images
Premium


Premium

Premium


Premium


Premium


Premium


Premium


Premium

Premium

Premium

Premium


Premium


Premium


Premium


Premium


Premium


Premium


Premium


Premium


Premium


Premium
Premium


Premium


Premium


Premium


Explore More Free Stock Images