- Home >
- Stock Photos >
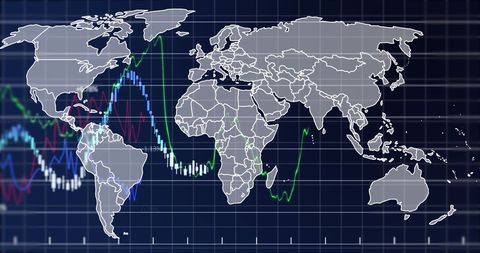
- Global Data Processing with Digital Graphical Interface
Global Data Processing with Digital Graphical Interface Image
Digital graph over a world map represents global data processing trends. Ideal for illustrating concepts in global business analytics, technology impact on worldwide markets, and advancements in data visualization techniques. Can be used in presentations focused on international data strategies or financial reports.

downloads
Tags:
More
Credit Photo
If you would like to credit the Photo, here are some ways you can do so
Text Link
photo Link
<span class="text-link">
<span>
<a target="_blank" href=https://pikwizard.com/photo/global-data-processing-with-digital-graphical-interface/da06f6fd6b107b051a0f122c204a0a43/>PikWizard</a>
</span>
</span>
<span class="image-link">
<span
style="margin: 0 0 20px 0; display: inline-block; vertical-align: middle; width: 100%;"
>
<a
target="_blank"
href="https://pikwizard.com/photo/global-data-processing-with-digital-graphical-interface/da06f6fd6b107b051a0f122c204a0a43/"
style="text-decoration: none; font-size: 10px; margin: 0;"
>
<img src="https://pikwizard.com/pw/medium/da06f6fd6b107b051a0f122c204a0a43.jpg" style="margin: 0; width: 100%;" alt="" />
<p style="font-size: 12px; margin: 0;">PikWizard</p>
</a>
</span>
</span>
Free (free of charge)
Free for personal and commercial use.
Author: People Creations