- Home >
- Stock Photos >
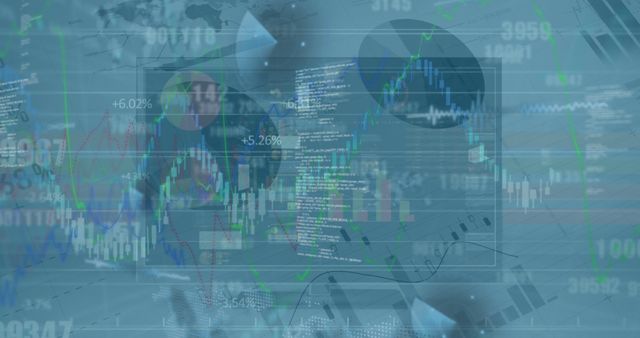
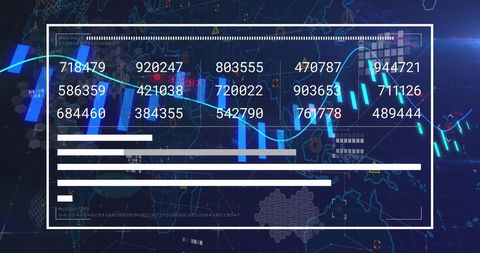
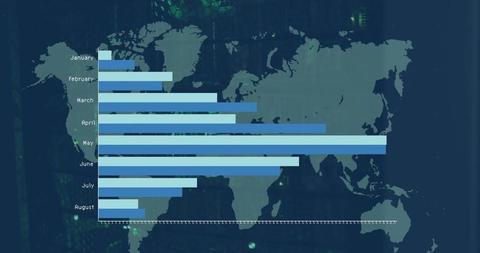
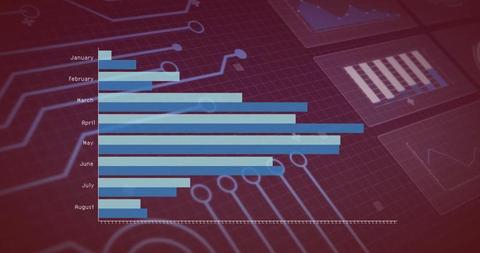
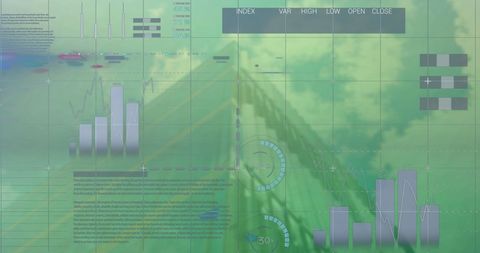
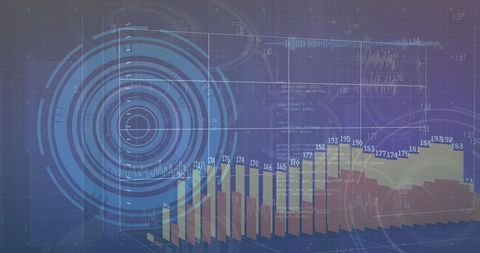
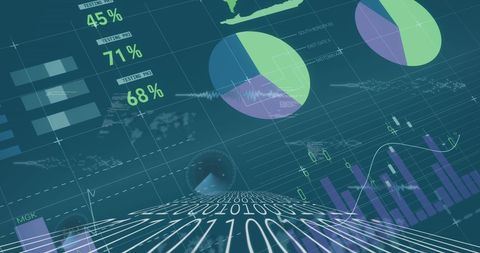
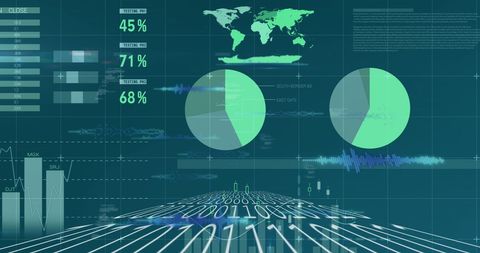
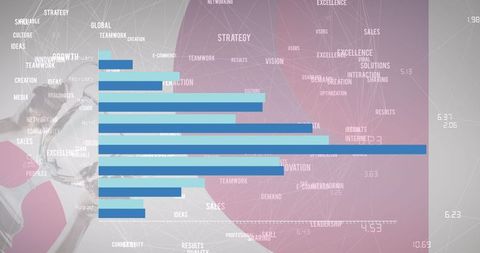
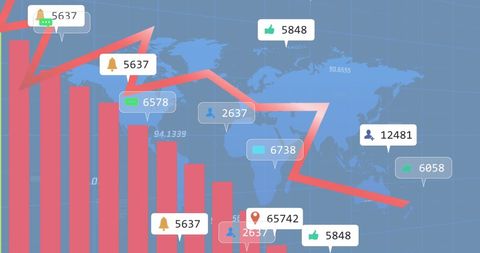
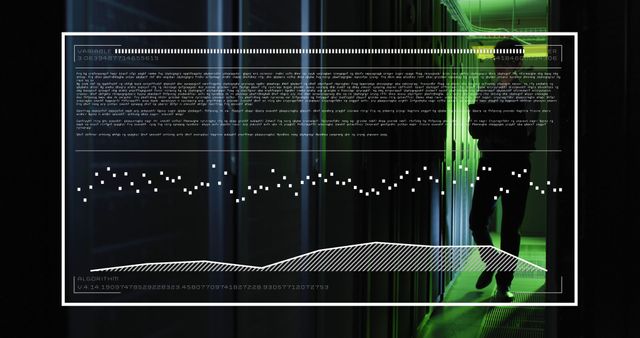
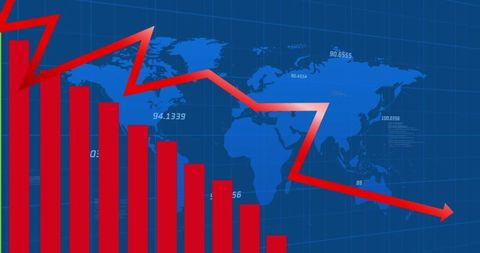
- Global Data Processing with Diversity and Interaction
Global Data Processing with Diversity and Interaction Image
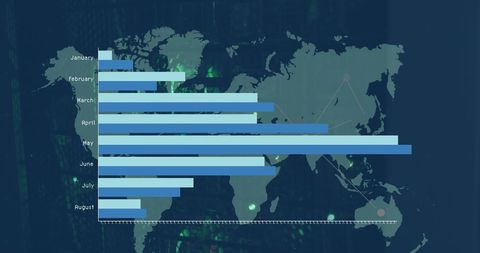
Visual represents data analysis overlaid on world map, illustrating concept of global data exchange and connectivity. Ideal for use in presentations about digital interfaces, technology, and analytics. Effectively communicates complex information in visually engaging way, suitable for tech conferences, public talks, or educational materials.

downloads
Tags:
More
Credit Photo
If you would like to credit the Photo, here are some ways you can do so
Text Link
photo Link
<span class="text-link">
<span>
<a target="_blank" href=https://pikwizard.com/photo/global-data-processing-with-diversity-and-interaction/ba5f5ff8730a5d90e8542cdac2dd15aa/>PikWizard</a>
</span>
</span>
<span class="image-link">
<span
style="margin: 0 0 20px 0; display: inline-block; vertical-align: middle; width: 100%;"
>
<a
target="_blank"
href="https://pikwizard.com/photo/global-data-processing-with-diversity-and-interaction/ba5f5ff8730a5d90e8542cdac2dd15aa/"
style="text-decoration: none; font-size: 10px; margin: 0;"
>
<img src="https://pikwizard.com/pw/medium/ba5f5ff8730a5d90e8542cdac2dd15aa.jpg" style="margin: 0; width: 100%;" alt="" />
<p style="font-size: 12px; margin: 0;">PikWizard</p>
</a>
</span>
</span>
Free (free of charge)
Free for personal and commercial use.
Author: Authentic Images