
- Home >
- Stock Photos >
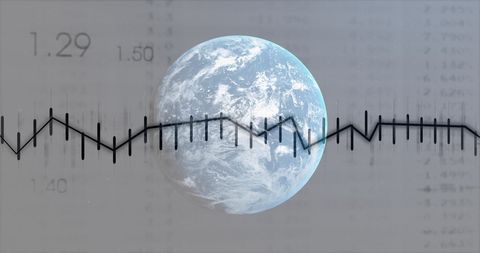
- Global Data Processing With World Map and Charts
Global Data Processing With World Map and Charts Image
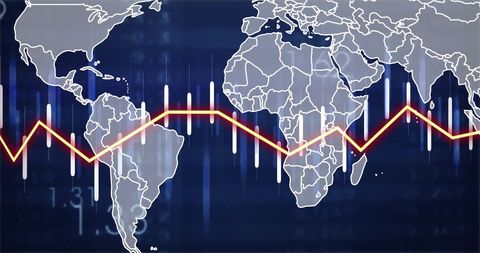
Digitally generated image showcasing data and economic trends on a world map. Represents interconnected world economy and technology-driven processes. Useful for illustrating articles about global business, technology strategies, international markets, and data analysis trends.
Powered by 


downloads
Tags:
More
Credit Photo
If you would like to credit the Photo, here are some ways you can do so
Text Link
photo Link
<span class="text-link">
<span>
<a target="_blank" href=https://pikwizard.com/photo/global-data-processing-with-world-map-and-charts/9b72f5a0b95b1b2af13512b1efc4bfe9/>PikWizard</a>
</span>
</span>
<span class="image-link">
<span
style="margin: 0 0 20px 0; display: inline-block; vertical-align: middle; width: 100%;"
>
<a
target="_blank"
href="https://pikwizard.com/photo/global-data-processing-with-world-map-and-charts/9b72f5a0b95b1b2af13512b1efc4bfe9/"
style="text-decoration: none; font-size: 10px; margin: 0;"
>
<img src="https://pikwizard.com/pw/medium/9b72f5a0b95b1b2af13512b1efc4bfe9.jpg" style="margin: 0; width: 100%;" alt="" />
<p style="font-size: 12px; margin: 0;">PikWizard</p>
</a>
</span>
</span>
Free (free of charge)
Free for personal and commercial use.
Author: Awesome Content
Similar Free Stock Images

Premium


Premium


Premium


Premium


Premium


Premium


Premium


Premium


Premium

Premium


Premium


Premium


Premium

Premium


Premium


Premium


Premium


Premium


Premium


Premium


Premium


Premium


Premium

Premium


Premium


Explore More Free Stock Images