- Home >
- Stock Photos >
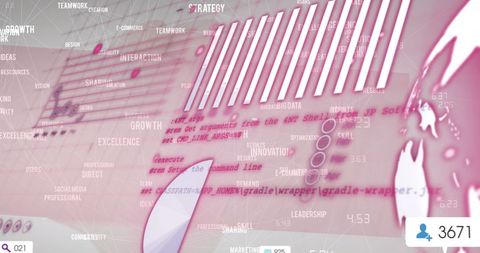
- Global Data Streams and Analytics Visualization
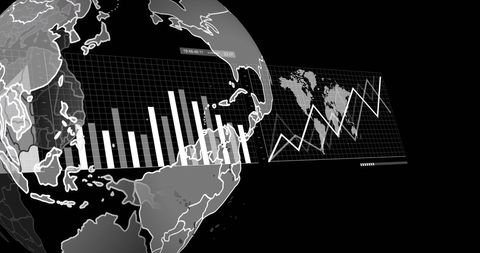
Global Data Streams and Analytics Visualization Image

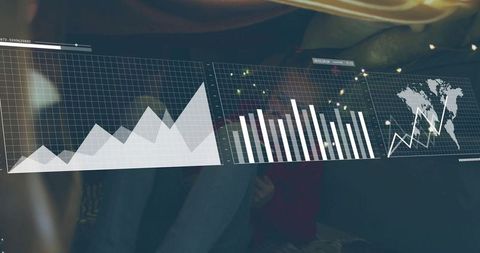
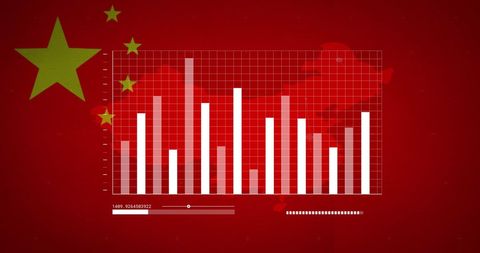
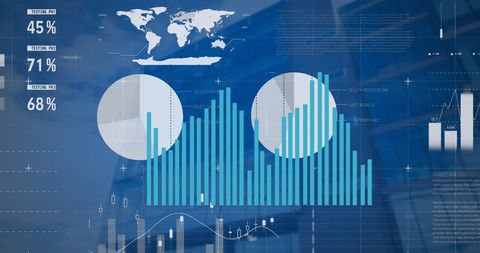
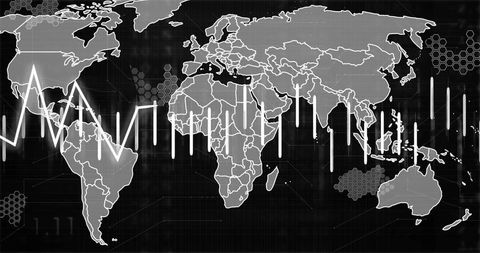
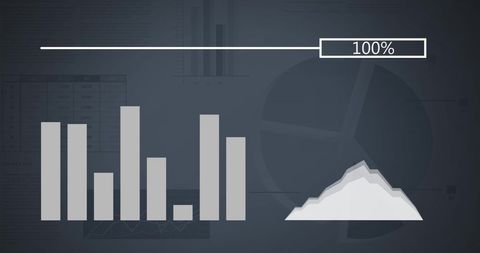
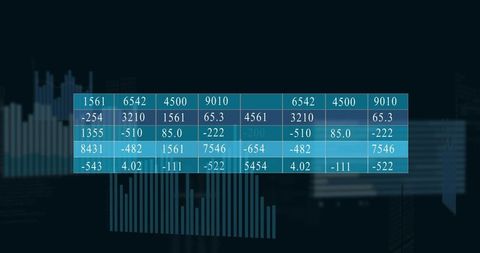
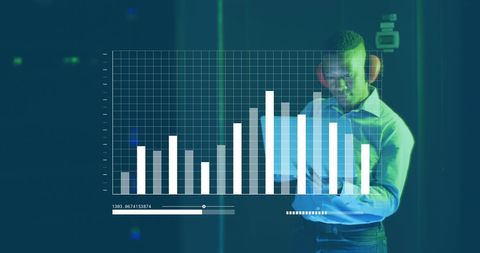
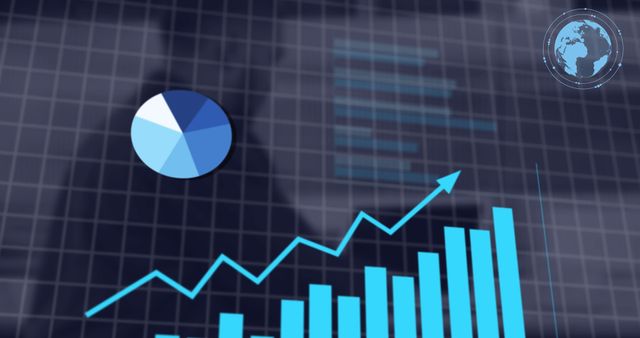
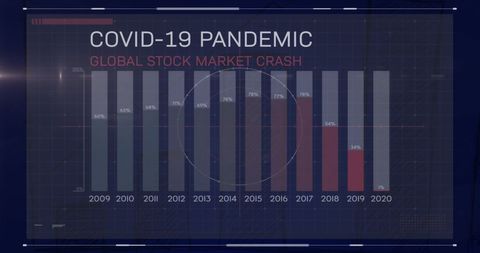
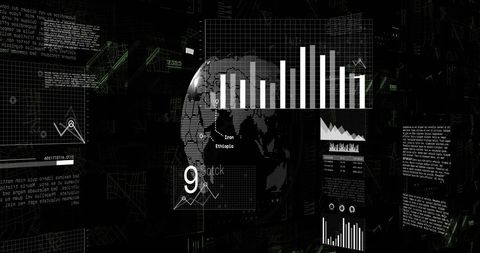
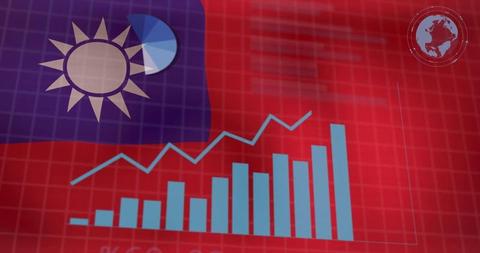
This abstract illustration combines graphical data elements with a world map and numbers to depict the concept of global data processing and analytics. Ideal for use in presentations, articles, and reports focusing on technology, data analytics, and information systems.

downloads
Tags:
More
Credit Photo
If you would like to credit the Photo, here are some ways you can do so
Text Link
photo Link
<span class="text-link">
<span>
<a target="_blank" href=https://pikwizard.com/photo/global-data-streams-and-analytics-visualization/4e8151b54de5edaec57d820b503517a7/>PikWizard</a>
</span>
</span>
<span class="image-link">
<span
style="margin: 0 0 20px 0; display: inline-block; vertical-align: middle; width: 100%;"
>
<a
target="_blank"
href="https://pikwizard.com/photo/global-data-streams-and-analytics-visualization/4e8151b54de5edaec57d820b503517a7/"
style="text-decoration: none; font-size: 10px; margin: 0;"
>
<img src="https://pikwizard.com/pw/medium/4e8151b54de5edaec57d820b503517a7.jpg" style="margin: 0; width: 100%;" alt="" />
<p style="font-size: 12px; margin: 0;">PikWizard</p>
</a>
</span>
</span>
Free (free of charge)
Free for personal and commercial use.
Author: Creative Art