
- Home >
- Stock Photos >
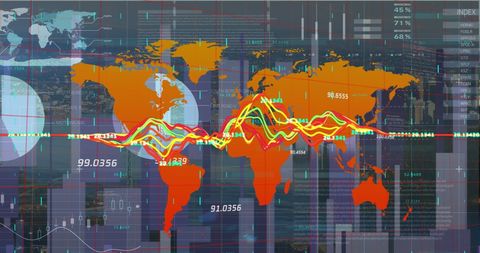
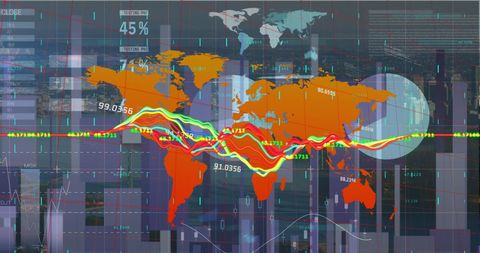
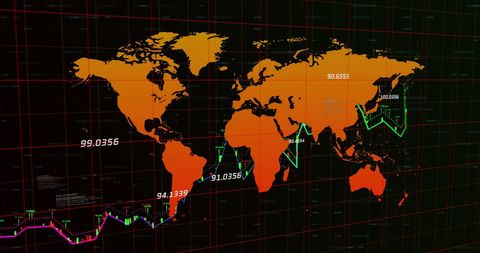
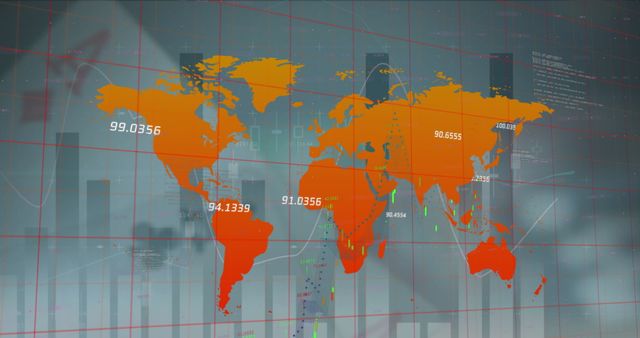
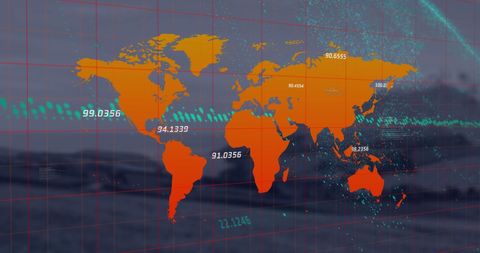
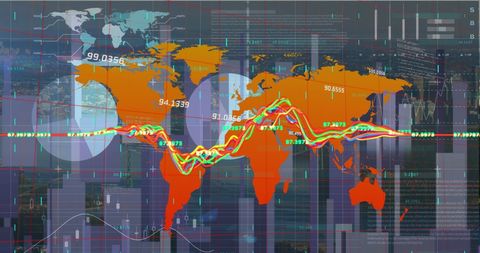
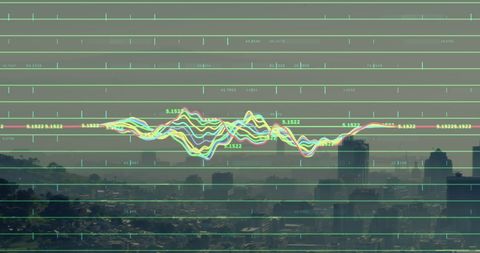
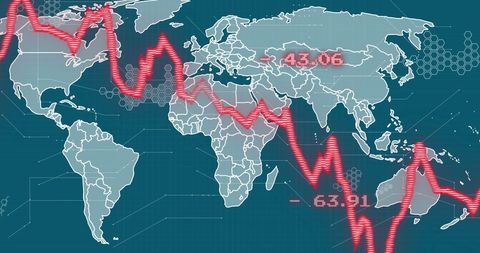
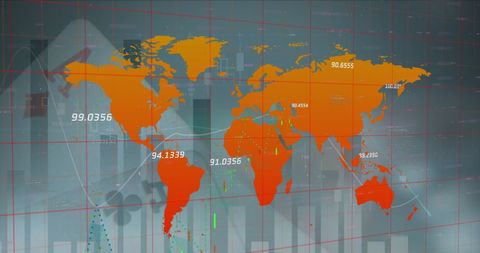
- Global Data Tracking on Digital World Map
Global Data Tracking on Digital World Map Image
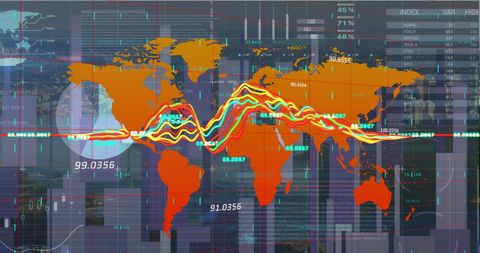
This image features a digital world map overlaid with complex statistical data graphs, set against a cityscape background. The graphical display illustrates global business connectivity and data flow, representing technology and analytics in a modern context. This visual can be used for presentations about global markets, data science, finance, technological innovation, or digital networking strategies.
Powered by 


downloads
Tags:
More
Credit Photo
If you would like to credit the Photo, here are some ways you can do so
Text Link
photo Link
<span class="text-link">
<span>
<a target="_blank" href=https://pikwizard.com/photo/global-data-tracking-on-digital-world-map/6390c34f9cda7c5ecffeb32713f8be0f/>PikWizard</a>
</span>
</span>
<span class="image-link">
<span
style="margin: 0 0 20px 0; display: inline-block; vertical-align: middle; width: 100%;"
>
<a
target="_blank"
href="https://pikwizard.com/photo/global-data-tracking-on-digital-world-map/6390c34f9cda7c5ecffeb32713f8be0f/"
style="text-decoration: none; font-size: 10px; margin: 0;"
>
<img src="https://pikwizard.com/pw/medium/6390c34f9cda7c5ecffeb32713f8be0f.jpg" style="margin: 0; width: 100%;" alt="" />
<p style="font-size: 12px; margin: 0;">PikWizard</p>
</a>
</span>
</span>
Free (free of charge)
Free for personal and commercial use.
Author: Authentic Images
Similar Free Stock Images

Premium

Premium

Premium


Premium


Premium


Premium


Premium


Premium


Premium


Premium


Premium


Premium


Premium

Premium

Premium


Premium


Premium

Premium


Premium

Premium


Premium


Premium


Premium


Premium

Premium


Explore More Free Stock Images