
- Home >
- Stock Photos >
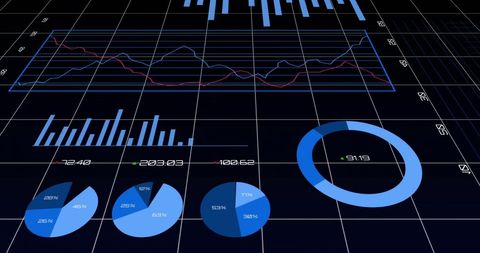
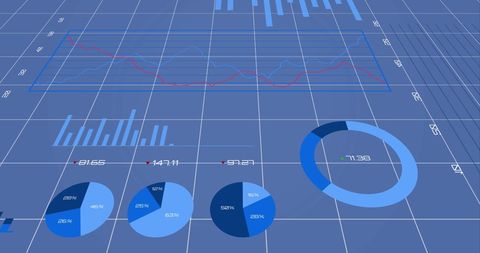
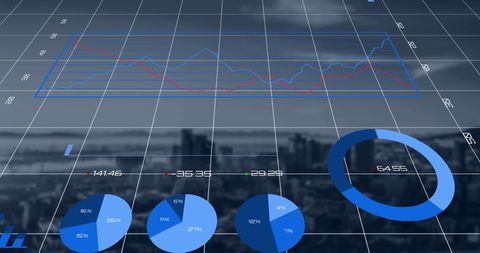
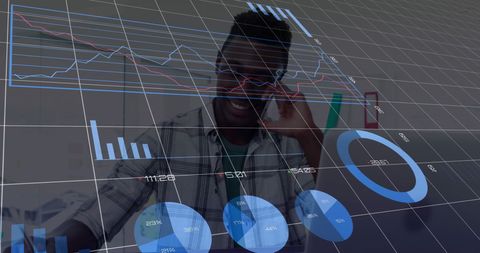
- Global Data Trends on Futuristic Digital Interface
Global Data Trends on Futuristic Digital Interface Image

Digital representation of global data trends highlighting graphs and charts on a virtual interface. This illustration is ideal for articles, blogs, and publications focused on analytics, showcasing technology and data visualization advancements. Perfect for use in presentations discussing innovation, emerging trends, and global data analysis.
Powered by  - Get 15% off with code: PIKWIZARD15


downloads
Tags:
More
Credit Photo
If you would like to credit the Photo, here are some ways you can do so
Text Link
photo Link
<span class="text-link">
<span>
<a target="_blank" href=https://pikwizard.com/photo/global-data-trends-on-futuristic-digital-interface/3198d91ca113fb799e06e1f50f1940b2/>PikWizard</a>
</span>
</span>
<span class="image-link">
<span
style="margin: 0 0 20px 0; display: inline-block; vertical-align: middle; width: 100%;"
>
<a
target="_blank"
href="https://pikwizard.com/photo/global-data-trends-on-futuristic-digital-interface/3198d91ca113fb799e06e1f50f1940b2/"
style="text-decoration: none; font-size: 10px; margin: 0;"
>
<img src="https://pikwizard.com/pw/medium/3198d91ca113fb799e06e1f50f1940b2.jpg" style="margin: 0; width: 100%;" alt="" />
<p style="font-size: 12px; margin: 0;">PikWizard</p>
</a>
</span>
</span>
Free (free of charge)
Free for personal and commercial use.
Author: People Creations
Similar Free Stock Images

Premium


Premium


Premium


Premium

Premium


Premium


Premium


Premium


Premium


Premium


Premium


Premium


Premium

Premium


Premium


Premium


Premium


Premium


Premium


Premium


Premium

Premium

Premium


Premium


Premium

Explore More Free Stock Images