1. Home > 
  2. Stock Photos > 
  3. Global Data Visualization and Analytics Dashboard Concept

Global Data Visualization and Analytics Dashboard Concept Image

Global Data Visualization and Analytics Dashboard Concept

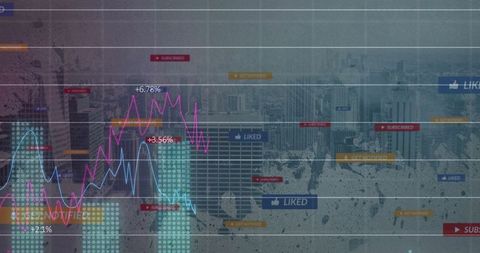
This symbolic representation comprises a world map with data points illustrating global trends and analytics. Ideal for use in presentations or content related to data science, global business trends, technology, and innovation. Visualizes the interconnectedness of international data with modern digital elements, making it perfect for illustrating tutorials on analytics or reports focusing on global statistics.

Powered by Adobe logo
Marketer using digital marketing dashboard with charts, pie graphs, organization chart, and performance data. Concept of business analytics and strategic planning. - Powered by AdobeVibrant workspace showcasing data analysis with colorful charts and graphs on a large digital dashboard display - Powered by AdobeBusinessman analyzing interactive data dashboard with graphs and charts on laptop using digital pen representing financial report business analytics strategy and modern technology for decision making - Powered by AdobeFuturistic holographic data hub with glowing blue towers and floating analytical dashboards displaying charts and graphs. - Powered by AdobeData flow from database and cloud to processing and analytics dashboards, representing data analysis, automation, insight generation, and digital intelligence Latch - Powered by Adobe

Credit Photo

If you would like to credit the Photo, here are some ways you can do so

Free (free of charge)

Free for personal and commercial use.

Author: People Creations

Similar Free Stock Images

Digital Data Processing Interface with Futuristic Visuals
Premium
Futuristic glowing blue digital dashboard with interactive charts graphs and analytics showing upward growth trend for business financial and technology data visualization concepts
Global Business and Finance Digital Concept Background
Global Map with Data Connections and Illuminated Nodes
Premium
Financial graph showing market data and investment trends on glass, blurring business people walking modern corporate corridor
Global Data Visualization with World Map Overlay
Financial Data Visualization on Digital World Map Background
Digital Data Processing and Global Networking Visualization
Futuristic Analytics Dashboard Displaying Line Chart, Sparklines, Notification Badges and Realtime M
Premium
A close-up of a digital screen displaying various data charts, graphs, and analytics in a modern office environment.
Futuristic Data Visualization with Charts and Graphs on Black Background
Global Business Infographic and Digital Data Interfaces
Global Network Connectivity with Data Visualization Overlay
Premium
Business professional using AI tools on laptop to visualize analytics, optimize data strategy, and improve organizational efficiency in real time
Premium
Military situational awareness grid cross-region monitoring risk-level indicators operational visualization.
Digital Data Processing and Analytics in Modern Business Innovation
Financial Data Processing with Charts and Graphics on Digital Blue Background
Colorful Line Graph on Digital Analytics Interface
Global Data Network with Interactive Digital World Map
Premium
Futuristic blue digital financial data visualization showing volatile stock market fluctuations.
Advanced Digital Data Analytics and Visualization Dashboard
Global Data Points Map with Numerical Analytics Overlay
Dynamic Financial Data on Global Blue Map Background
Global Data Trends on Digital Dashboard with Analytics Overlay
Premium
An AI project management dashboard with business performance analytics. AI visualization of project timelines and company data for strategic review. Motif
Digital Global Map Interface with Data Streams
Digital Stock Market Data over World Map
Global Financial Data Processing with Graphs and Charts Overlay
Data Security and Cyber Protection with Global Digital Network
Premium
Doctor using digital tablet and laptop with AI dashboard holographic checklist overlay, analyzing KPI, workflow process, and compliance data visualization in modern healthcare digital environment.
Global Financial Data with World Map on Contemporary Digital Interface
Global Data Analytics and Network Visualization on Digital Grid
Global Pandemic Impact on Organic Tourism and Health Sector
Digital World Map with Global Financial Data Visualization
Digital Data Analysis Over World Map Illustrating Global Connections
Abstract Global Data Analytics on Blue World Map
Dynamic Data Analytics Interface Showing Statistical Trends
Premium
A tablet shows performance data while delivery vans are parked in a spacious warehouse, emphasizing logistics operations
Digital World Map with Global Data Network
Digital Blue World Map with Financial Data for Stock Market Analysis
Global Digital Interface with Interactive Data Visualization
Abstract Global Connections with Digital Data Over World Map
Premium
Digital HR analytics dashboard with recruitment interface, employee evaluation, and workforce management system, showing data visualization, checklist, performance metrics for business transformation
Abstract Data Interface with World Map and Bar Charts
Global Economy Trends with Digital Graph Visualization
Global Financial Trends and Market Indicators
Global Data Transfer with Digital Analytics and Visualization
Premium
AI finance business data analysis digital technology investment trading market stock, financial analyst using advanced holographic interface for global market insight, smart investment strategy
World Map with Data Points Illustrating Global Finance Trends
Digital Global Financial Data Display with World Map
Global Data Processing with Digital Maps and Graphs
Global Financial Analysis with Digital Interface Technology Overlay
Premium
AI data analytics dashboard, business data insights, AI-powered data analysis dashboard, business strategy, Analyst or Scientist uses a computer and dashboard for analysis of information development
Dynamic Financial Data Analysis on Blue Digital Interface
Global Data Analytics with World Map and Bar Graph
Dark Financial Dashboard Displaying Real-Time Analytics, Index Table, Americas Map, Gauges
Digital Data Interfaces and Global Communication Concepts
Premium
Digital dashboard with colorful bars
Digital World Map Overlaid on Urban Cityscape with Data Graphics
Global Financial Data on Digital World Map for Analytics
Global Data Flow on Digital Blue World Map
Global data visualization dashboard displaying neon world map with flight arc and telemetry
Premium
Professional analyst reviews dynamic financial data visualizations on a modern laptop, driving business growth and informed decisions.
Dynamic Digital Data Visualization with Graphs and Statistics
Dynamic Digital Interface Displaying Financial Data Analysis
Premium
Digital HR system showing employee KPI data, team performance metrics and productivity dashboards used by organizations for workforce evaluation and human resource data driven decision making
Premium
A recruitment technology dashboard hologram digital network data visualization abstract workforce human icon AI analytics
Futuristic World Map with Digital Data Visualization Overlay
Holographic Financial Infographic with Global Report Interface
Global Connectivity and Financial Analysis
Global Finance and Economy Interface with Digital Graphs
Premium
Close-up of person's hand using a tablet with futuristic interface and data visualization at night
Digital Data Processing on World Map for Global Business Solutions
Digital Graph Interface Illustrating Financial Data Analysis
Global Financial Data Analysis and Technology Trends
Global Financial Data and Stock Market Trends Over World Map
Digital Financial Data Processing Interface with Graphs and Codes
Global Financial Data and Stock Market Visualization
Digital Data Visualization Overlaying Sports Stadium
Digital Interface Displaying Data Processing Analytics on Black Background
Premium
Professional researcher analyzing AI logistics dashboard with futuristic holographic interface. Concept of artificial intelligence, supply chain, digital innovation, and modern design. Collage
Futuristic Urban Analytics with Overlaid Graphs and Data Tags
Financial Data Analytics on Digital Interface
Digital Financial Data Interface with Charts and Graphs on Blue Background
Digital Map with Data Overlay and Security Interface Concept
Premium
Hand pointing at interactive dashboard with analytics graphs and charts on a large touchscreen display, highlighting data trends and performance metrics in a modern digital workspace.
Global Data Processing Technology on Digital Grid
Financial Data Visualization with Gridlines and Trends
Abstract Digital Data Charts Illustrating Market Trends
Global Financial Data Processing on World Map
Premium
KPI analytics dashboard showing charts, performance metrics, AI insights and task checklists used by man on tablet for business data analysis, digital strategy planning and productivity management
Premium
AI analytics background, big data visualization, machine-learning insights, cyber data intelligence, digital processing flow, global data network, predictive analytics, neural data visualization.
Futuristic Global Data Analytics World Map Visualization
Financial Market Love: Red Hearts and Economic Graph Integration
Financial Data Over Electric Sky Concept for Energy Sector
Global Data Connections on Digital Interface Display
Global Financial Data Analysis with Blue World Map Illustration
Digital Finance Data Overlay with Dynamic Graphs
Futuristic NFT Concept with Digital World Map Design
Global Stock Market Trends With Digital World Map
Global Data Processing and Digital Interface Concept
Premium
Displaying network graph animating in 3D dashboard with teal nodes, purple bars and numeric labels
Global Technology Network with Digital Icons on World Map
Global Data Points on Abstract World Map with Digital Interface
Digital Projection of Financial Data with Bar Graphs
Global Financial Data Visualizations with Charts and World Map
Premium
AI summary technology concept with digital data visualization. Person using artificial intelligence tools to generate automated summaries, improving productivity and efficiency in data analysis tasks.
Futuristic Global Data Analytics with World Map Overlay
Global Networking Concept with World Map and Data Flow Lines at Night
Dynamic Stock Market Chart with Shoe Icons Overlay
Global Financial Data and Digital Interface Visualization
Financial Data Visualization with Growing Business Charts
Premium
Business professional analyzing performance dashboard on digital tablet, visualizing KPI metrics, business insights, and data-driven strategy for corporate success and informed decision making.
Dynamic Financial Data Analytics with Stock Market Trends
Global Data Analytics with Interactive World Map and Diagrams
Digital Data Visualization Over Urban Skyline Concept
Neon Circle Highlights Bullish Trend on Digital Dashboard
Premium
Marketing Manager Using Laptop
Innovative Data Analytics Dashboard with Global Visualization
Global Data Trends and Analytics Visualized Over World Map
Global Financial Data Analysis with Digital World Map Visualization
3D Digital Globe with Financial Data Overlay for Analytics
Digital Data Analysis with Futuristic Charts
Global Genetic Research with DNA Helix and World Map Illustration
Global Financial Data Overlay World Map on Black Background
Explore More Free Stock Images