- Home >
- Stock Photos >
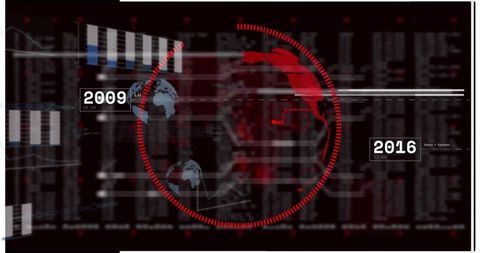
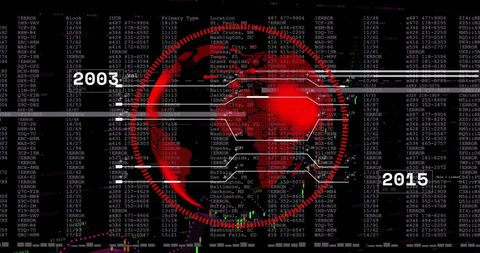
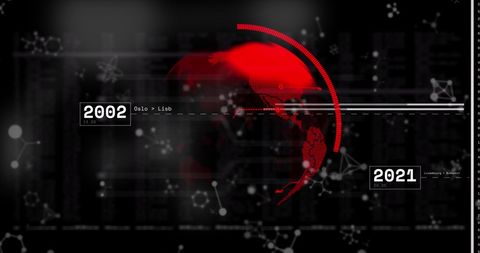
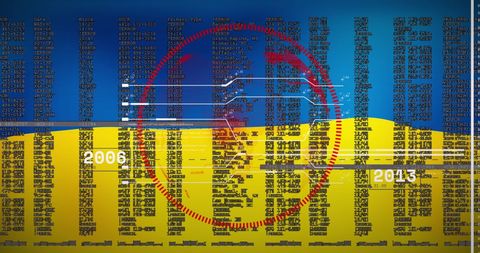
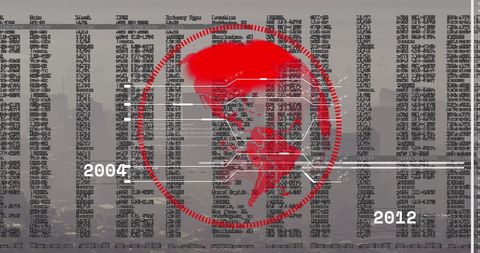
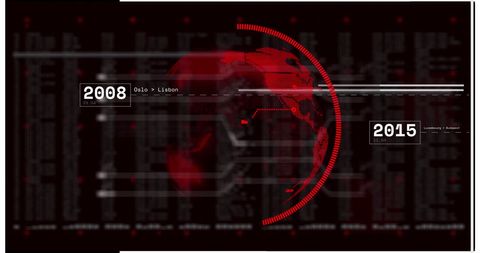
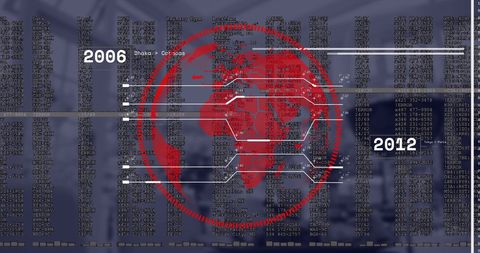
- Global Data Visualization in Red with Timeline Markers
Global Data Visualization in Red with Timeline Markers Image

Stylized depiction of a digital interface featuring a red globe amidst a background of streaming data and code, marked with distinct timeline indicators for 2004 and 2012. This dynamic visual represents advancing technology and data analysis themes. Useful for presentations or materials related to technology advancements, cyber security frameworks, or global data trends.

downloads
Tags:
More
Credit Photo
If you would like to credit the Photo, here are some ways you can do so
Text Link
photo Link
<span class="text-link">
<span>
<a target="_blank" href=https://pikwizard.com/photo/global-data-visualization-in-red-with-timeline-markers/940093667c212a6d46ca76d55f03d8c4/>PikWizard</a>
</span>
</span>
<span class="image-link">
<span
style="margin: 0 0 20px 0; display: inline-block; vertical-align: middle; width: 100%;"
>
<a
target="_blank"
href="https://pikwizard.com/photo/global-data-visualization-in-red-with-timeline-markers/940093667c212a6d46ca76d55f03d8c4/"
style="text-decoration: none; font-size: 10px; margin: 0;"
>
<img src="https://pikwizard.com/pw/medium/940093667c212a6d46ca76d55f03d8c4.jpg" style="margin: 0; width: 100%;" alt="" />
<p style="font-size: 12px; margin: 0;">PikWizard</p>
</a>
</span>
</span>
Free (free of charge)
Free for personal and commercial use.
Author: Creative Art