
- Home >
- Stock Photos >
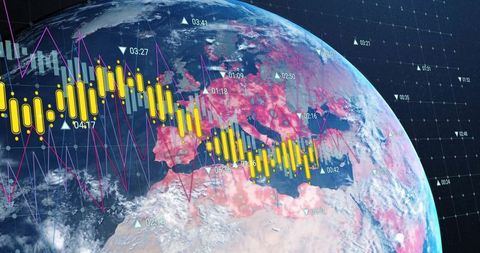
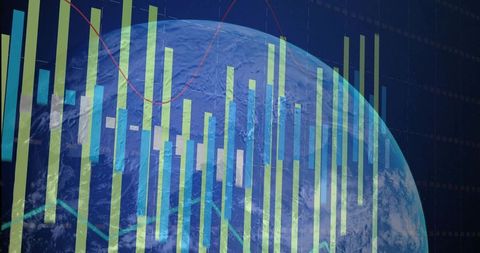
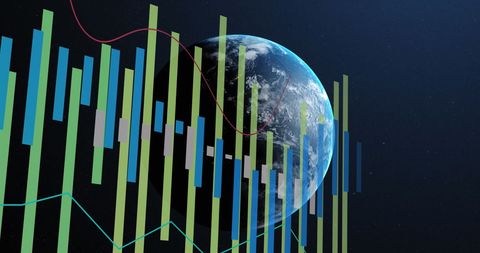
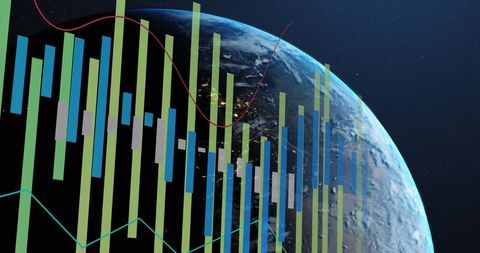
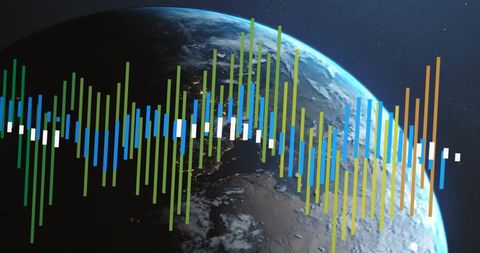
- Global Data Visualization Over Earth Background
Global Data Visualization Over Earth Background Image
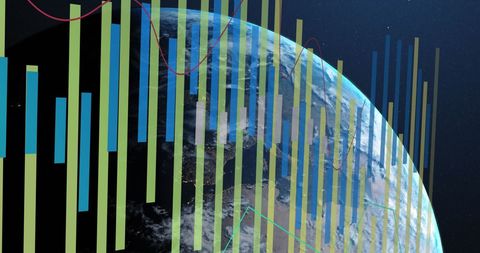
Visual juxtaposition of data graphs over Earth highlights global business, technology, and communication. Ideal for illustrating concepts like worldwide data processing, global computing networks, and international business strategies. Can be used in presentations, articles, and digital content about technology and globalization.
Powered by 


downloads
Tags:
More
Credit Photo
If you would like to credit the Photo, here are some ways you can do so
Text Link
photo Link
<span class="text-link">
<span>
<a target="_blank" href=https://pikwizard.com/photo/global-data-visualization-over-earth-background/ef2e20e8d4c2b4e2923e372588b91ba8/>PikWizard</a>
</span>
</span>
<span class="image-link">
<span
style="margin: 0 0 20px 0; display: inline-block; vertical-align: middle; width: 100%;"
>
<a
target="_blank"
href="https://pikwizard.com/photo/global-data-visualization-over-earth-background/ef2e20e8d4c2b4e2923e372588b91ba8/"
style="text-decoration: none; font-size: 10px; margin: 0;"
>
<img src="https://pikwizard.com/pw/medium/ef2e20e8d4c2b4e2923e372588b91ba8.jpg" style="margin: 0; width: 100%;" alt="" />
<p style="font-size: 12px; margin: 0;">PikWizard</p>
</a>
</span>
</span>
Free (free of charge)
Free for personal and commercial use.
Author: People Creations
Similar Free Stock Images

Premium


Premium

Premium


Premium


Premium

Premium


Premium


Premium


Premium


Premium


Premium


Premium


Premium


Premium


Premium


Premium


Premium


Premium


Premium

Premium


Premium

Premium

Premium


Premium


Premium


Explore More Free Stock Images