- Home >
- Stock Photos >
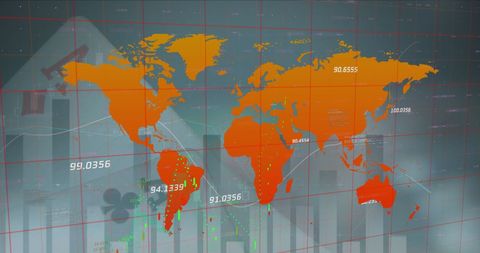
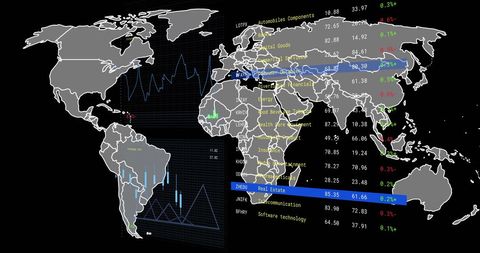
- Global Data Visualization Overlay with Map and Graphs
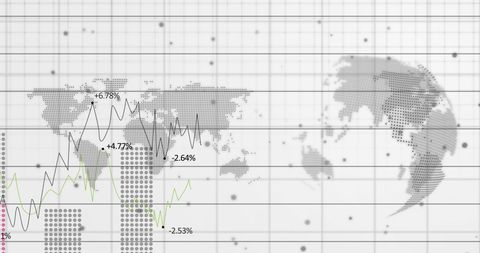
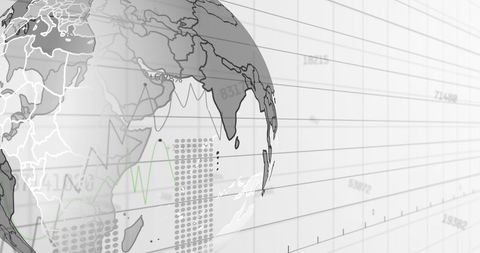
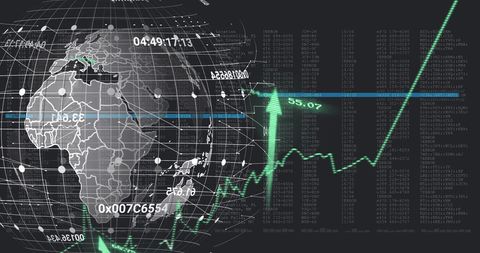
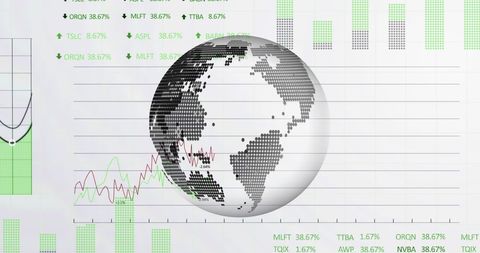
Global Data Visualization Overlay with Map and Graphs Image

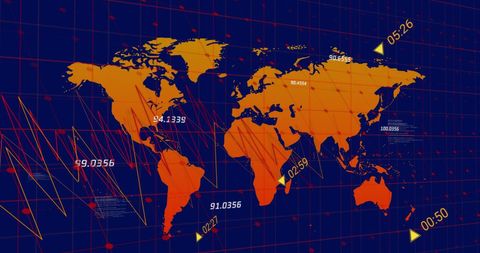
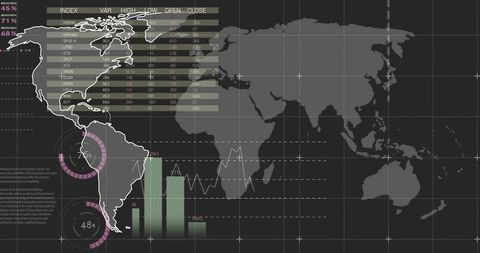
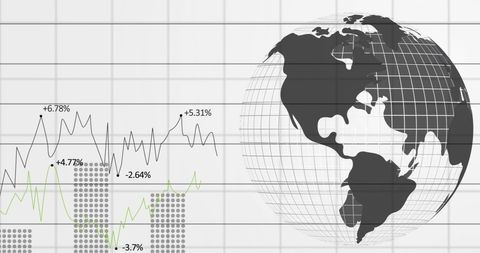
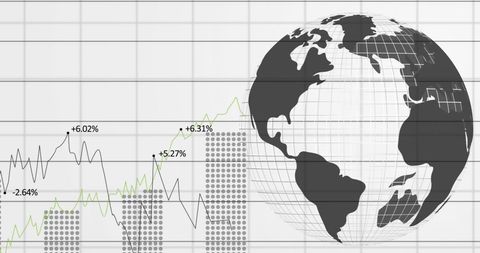
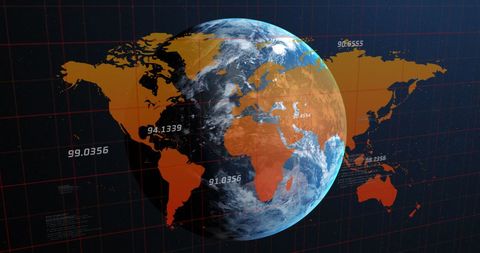
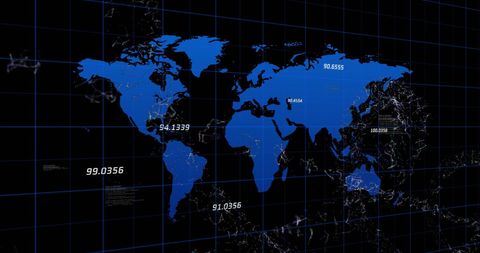
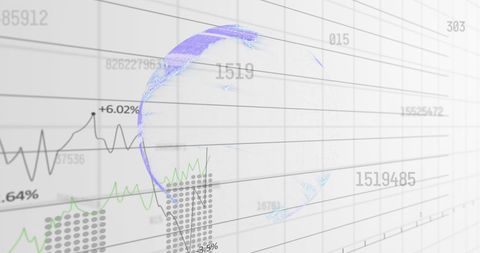
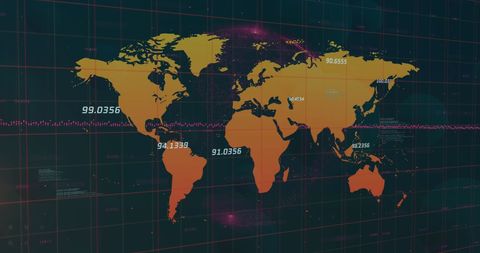
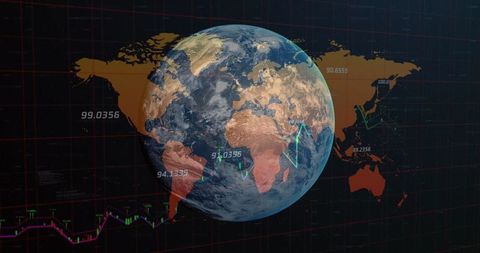
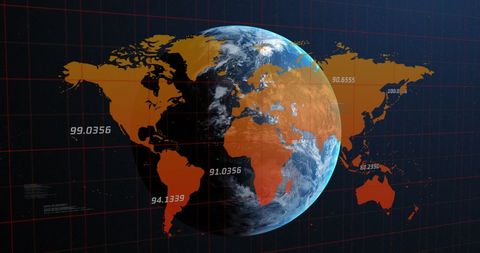
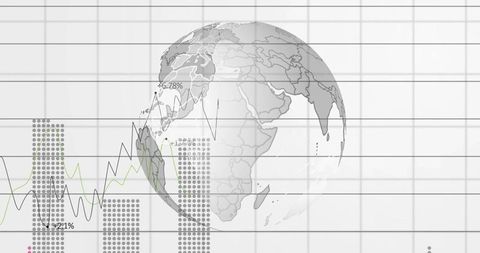
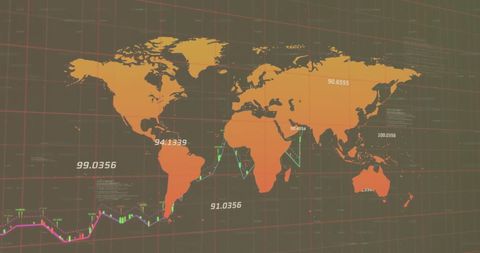
Depicts concept of global connectivity and data processing with world map overlayed by data graphs. Represents digital analytics, worldwide business analysis, and technological networks. Useful for topics on global business, big data analytics, digital technology, and international trends.

downloads
Tags:
More
Credit Photo
If you would like to credit the Photo, here are some ways you can do so
Text Link
photo Link
<span class="text-link">
<span>
<a target="_blank" href=https://pikwizard.com/photo/global-data-visualization-overlay-with-map-and-graphs/aef405c3beefd622b915ffafd97e7318/>PikWizard</a>
</span>
</span>
<span class="image-link">
<span
style="margin: 0 0 20px 0; display: inline-block; vertical-align: middle; width: 100%;"
>
<a
target="_blank"
href="https://pikwizard.com/photo/global-data-visualization-overlay-with-map-and-graphs/aef405c3beefd622b915ffafd97e7318/"
style="text-decoration: none; font-size: 10px; margin: 0;"
>
<img src="https://pikwizard.com/pw/medium/aef405c3beefd622b915ffafd97e7318.jpg" style="margin: 0; width: 100%;" alt="" />
<p style="font-size: 12px; margin: 0;">PikWizard</p>
</a>
</span>
</span>
Free (free of charge)
Free for personal and commercial use.
Author: Authentic Images