
- Home >
- Stock Photos >
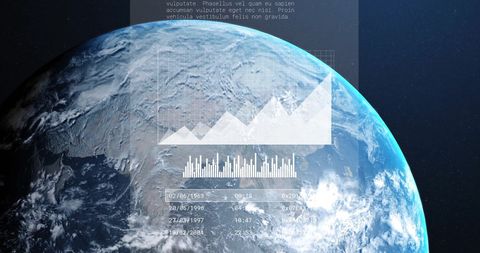
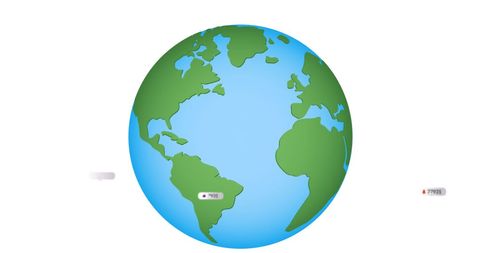
- Global Data Visualization with Bar Graph over World Globe
Global Data Visualization with Bar Graph over World Globe Image
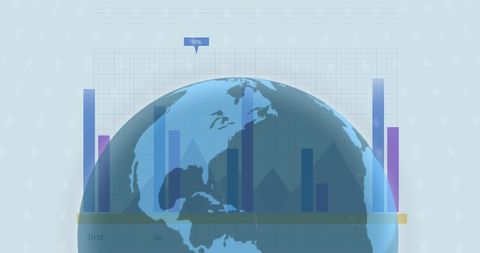
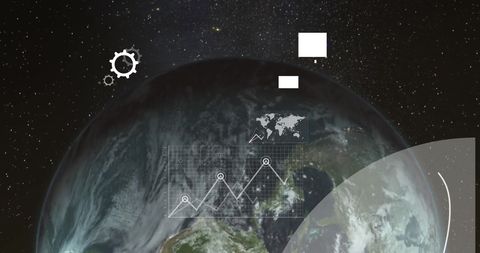
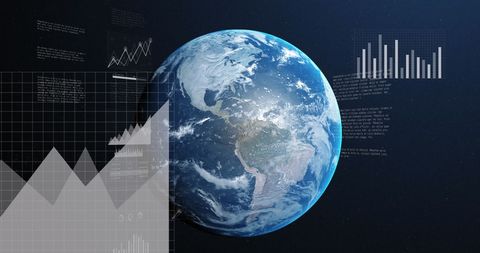
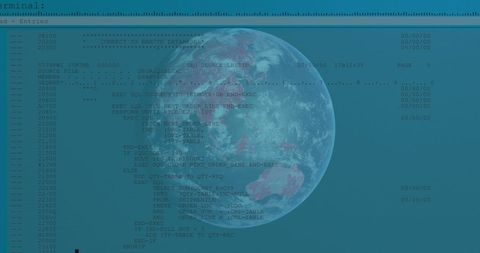
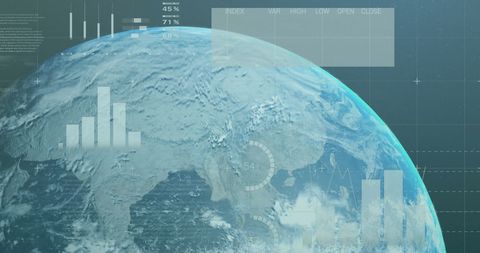
This visually compelling illustration features a semi-transparent globe superimposed with bar graphs, creating an intriguing visual of global data processing and financial statistics. Ideal for use in presentations or reports on global economics, finance strategies, or data technology integration. Enhances materials focusing on international business analytics or digital transformation showcases.
Powered by 


downloads
Tags:
More
Credit Photo
If you would like to credit the Photo, here are some ways you can do so
Text Link
photo Link
<span class="text-link">
<span>
<a target="_blank" href=https://pikwizard.com/photo/global-data-visualization-with-bar-graph-over-world-globe/93b14558a0b684d11dc2cd951949b6a4/>PikWizard</a>
</span>
</span>
<span class="image-link">
<span
style="margin: 0 0 20px 0; display: inline-block; vertical-align: middle; width: 100%;"
>
<a
target="_blank"
href="https://pikwizard.com/photo/global-data-visualization-with-bar-graph-over-world-globe/93b14558a0b684d11dc2cd951949b6a4/"
style="text-decoration: none; font-size: 10px; margin: 0;"
>
<img src="https://pikwizard.com/pw/medium/93b14558a0b684d11dc2cd951949b6a4.jpg" style="margin: 0; width: 100%;" alt="" />
<p style="font-size: 12px; margin: 0;">PikWizard</p>
</a>
</span>
</span>
Free (free of charge)
Free for personal and commercial use.
Author: Awesome Content
Similar Free Stock Images

Premium


Premium


Premium


Premium


Premium


Premium


Premium


Premium


Premium


Premium

Premium


Premium


Premium


Premium


Premium


Premium


Premium


Premium

Premium

Premium


Premium

Premium


Premium


Premium


Premium


Explore More Free Stock Images