- Home >
- Stock Photos >
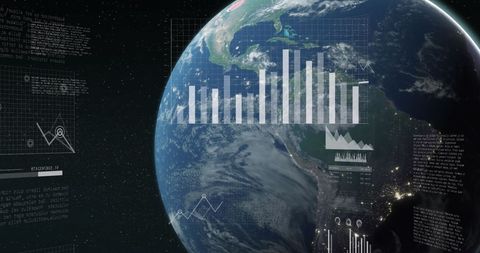
- Global Data Visualization with Binary and Statistics Graphics
Global Data Visualization with Binary and Statistics Graphics Image

This digital graphic shows a combination of global data processing elements including binary code, a world map, and statistical graphics, creating a dynamic visualization of technology’s global reach. Wired against the dark, network-like background, it represents data handling and technology trends. Perfect for using in presentations about global technology developments, data analysis themes, corporate reports involving digital transformation initiatives, and educational materials on computing.

downloads
Tags:
More
Credit Photo
If you would like to credit the Photo, here are some ways you can do so
Text Link
photo Link
<span class="text-link">
<span>
<a target="_blank" href=https://pikwizard.com/photo/global-data-visualization-with-binary-and-statistics-graphics/6b82f2af830f6750cf22a61a3aa8d2b2/>PikWizard</a>
</span>
</span>
<span class="image-link">
<span
style="margin: 0 0 20px 0; display: inline-block; vertical-align: middle; width: 100%;"
>
<a
target="_blank"
href="https://pikwizard.com/photo/global-data-visualization-with-binary-and-statistics-graphics/6b82f2af830f6750cf22a61a3aa8d2b2/"
style="text-decoration: none; font-size: 10px; margin: 0;"
>
<img src="https://pikwizard.com/pw/medium/6b82f2af830f6750cf22a61a3aa8d2b2.jpg" style="margin: 0; width: 100%;" alt="" />
<p style="font-size: 12px; margin: 0;">PikWizard</p>
</a>
</span>
</span>
Free (free of charge)
Free for personal and commercial use.
Author: Authentic Images