
- Home >
- Stock Photos >
- Global Data Visualization With Digital Graphs and Holograms
Global Data Visualization With Digital Graphs and Holograms Image

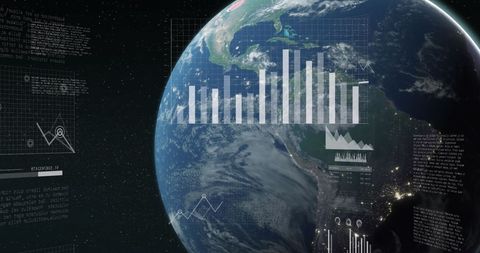
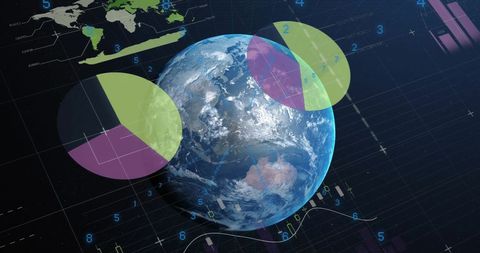
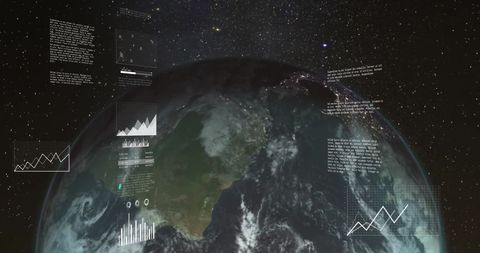
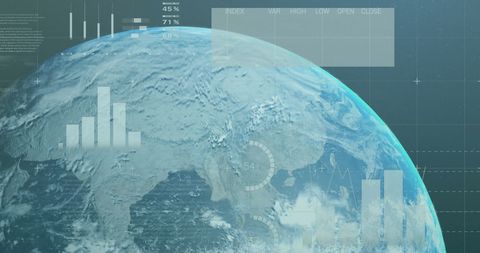
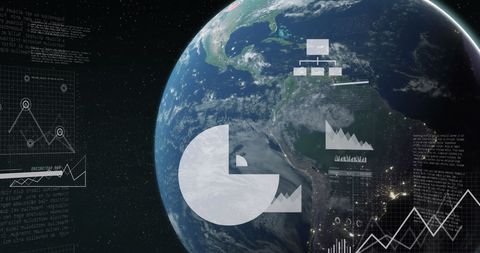
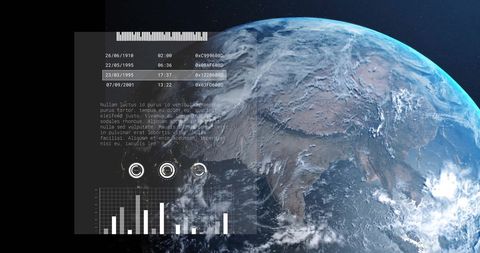
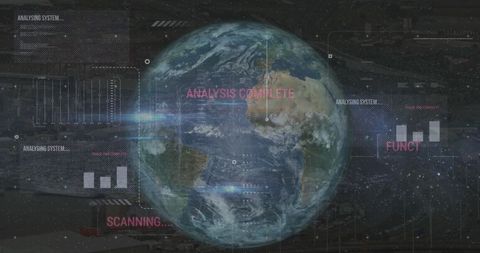
This visually engaging concept showcases Earth surrounded by digital graphs and holograms, encapsulating themes of global data and technological innovation. Ideal for illustrating concepts like worldwide connectivity, financial analysis, and data-driven decisions, it can be an excellent choice for business reports and tech articles.
Powered by 


downloads
Tags:
More
Credit Photo
If you would like to credit the Photo, here are some ways you can do so
Text Link
photo Link
<span class="text-link">
<span>
<a target="_blank" href=https://pikwizard.com/photo/global-data-visualization-with-digital-graphs-and-holograms/1cd00e2637ad0ca66de259e4ad9bd596/>PikWizard</a>
</span>
</span>
<span class="image-link">
<span
style="margin: 0 0 20px 0; display: inline-block; vertical-align: middle; width: 100%;"
>
<a
target="_blank"
href="https://pikwizard.com/photo/global-data-visualization-with-digital-graphs-and-holograms/1cd00e2637ad0ca66de259e4ad9bd596/"
style="text-decoration: none; font-size: 10px; margin: 0;"
>
<img src="https://pikwizard.com/pw/medium/1cd00e2637ad0ca66de259e4ad9bd596.jpg" style="margin: 0; width: 100%;" alt="" />
<p style="font-size: 12px; margin: 0;">PikWizard</p>
</a>
</span>
</span>
Free (free of charge)
Free for personal and commercial use.
Author: Awesome Content
Similar Free Stock Images
Premium


Premium


Premium


Premium


Premium


Premium

Premium


Premium


Premium


Premium


Premium


Premium


Premium


Premium


Premium


Premium


Premium

Premium

Premium


Premium


Premium


Premium


Premium


Premium


Premium

Explore More Free Stock Images