
- Home >
- Stock Photos >
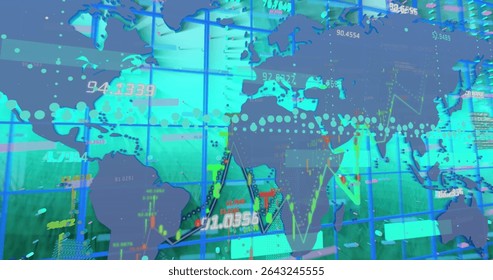
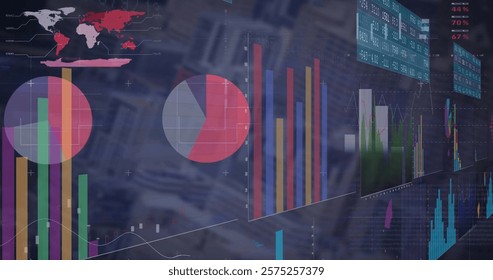
- Global Data Visualization with Digital World Map and Analytical Graphs
Global Data Visualization with Digital World Map and Analytical Graphs Image

Visual representation of global data analytics showcases interconnected networks and information flow over a stylized digital world map. Ideal for illustrating trends in technology, global communications, or international business in presentations, blogs, and technology publications.
Powered by  - Get 15% off with code: PIKWIZARD15


downloads
Tags:
More
Credit Photo
If you would like to credit the Photo, here are some ways you can do so
Text Link
photo Link
<span class="text-link">
<span>
<a target="_blank" href=https://pikwizard.com/photo/global-data-visualization-with-digital-world-map-and-analytical-graphs/5ea181e2e170e965d1f3cbee072d7bb4/>PikWizard</a>
</span>
</span>
<span class="image-link">
<span
style="margin: 0 0 20px 0; display: inline-block; vertical-align: middle; width: 100%;"
>
<a
target="_blank"
href="https://pikwizard.com/photo/global-data-visualization-with-digital-world-map-and-analytical-graphs/5ea181e2e170e965d1f3cbee072d7bb4/"
style="text-decoration: none; font-size: 10px; margin: 0;"
>
<img src="https://pikwizard.com/pw/medium/5ea181e2e170e965d1f3cbee072d7bb4.jpg" style="margin: 0; width: 100%;" alt="" />
<p style="font-size: 12px; margin: 0;">PikWizard</p>
</a>
</span>
</span>
Free (free of charge)
Free for personal and commercial use.
Author: People Creations
Similar Free Stock Images

Premium


Premium
Premium


Premium


Premium


Premium


Premium


Premium

Premium


Premium


Premium


Premium


Premium


Premium


Premium


Premium

Premium


Premium


Premium


Premium


Premium


Premium


Premium


Premium


Premium
Explore More Free Stock Images