- Home >
- Stock Photos >
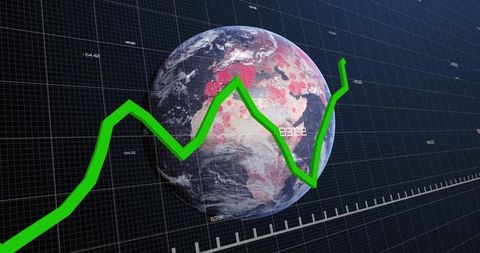
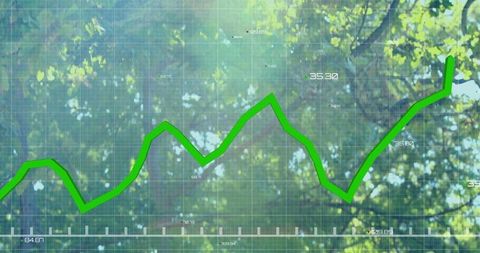
- Global Data Visualization with Dynamic Green Graph
Global Data Visualization with Dynamic Green Graph Image

This image features a dynamic green line graph over a three-dimensional globe. Red circles and numeric labels add layers of information, illustrating data analytics in finance and technology. Ideal for presentations on global business strategies, technological initiatives, high-tech solutions, and innovation trends concerns.

downloads
Tags:
More
Credit Photo
If you would like to credit the Photo, here are some ways you can do so
Text Link
photo Link
<span class="text-link">
<span>
<a target="_blank" href=https://pikwizard.com/photo/global-data-visualization-with-dynamic-green-graph/dc8a58670fb53842864155b890c2287a/>PikWizard</a>
</span>
</span>
<span class="image-link">
<span
style="margin: 0 0 20px 0; display: inline-block; vertical-align: middle; width: 100%;"
>
<a
target="_blank"
href="https://pikwizard.com/photo/global-data-visualization-with-dynamic-green-graph/dc8a58670fb53842864155b890c2287a/"
style="text-decoration: none; font-size: 10px; margin: 0;"
>
<img src="https://pikwizard.com/pw/medium/dc8a58670fb53842864155b890c2287a.jpg" style="margin: 0; width: 100%;" alt="" />
<p style="font-size: 12px; margin: 0;">PikWizard</p>
</a>
</span>
</span>
Free (free of charge)
Free for personal and commercial use.
Author: Authentic Images