
- Home >
- Stock Photos >
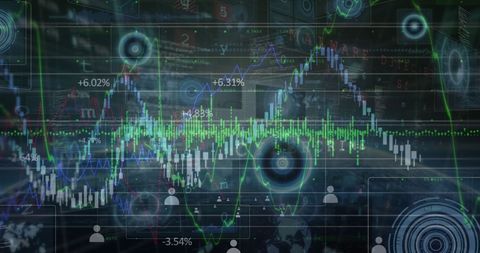
- Global Data Visualization with Financial Graphs and Analytics
Global Data Visualization with Financial Graphs and Analytics Image

This visualization depicts digital analytics overlaid on global networks and financial charts, illustrating insights related to global financial trends and statistical analysis. It is ideal for presentations or publications focused on international finance, big data technologies, or business intelligence applications. Suitable for educators, financial analysts, and tech companies aiming to highlight innovations in data-driven strategy.
Powered by 


downloads
Tags:
More
Credit Photo
If you would like to credit the Photo, here are some ways you can do so
Text Link
photo Link
<span class="text-link">
<span>
<a target="_blank" href=https://pikwizard.com/photo/global-data-visualization-with-financial-graphs-and-analytics/b1ed4cfa0b8040613071489536e509fb/>PikWizard</a>
</span>
</span>
<span class="image-link">
<span
style="margin: 0 0 20px 0; display: inline-block; vertical-align: middle; width: 100%;"
>
<a
target="_blank"
href="https://pikwizard.com/photo/global-data-visualization-with-financial-graphs-and-analytics/b1ed4cfa0b8040613071489536e509fb/"
style="text-decoration: none; font-size: 10px; margin: 0;"
>
<img src="https://pikwizard.com/pw/medium/b1ed4cfa0b8040613071489536e509fb.jpg" style="margin: 0; width: 100%;" alt="" />
<p style="font-size: 12px; margin: 0;">PikWizard</p>
</a>
</span>
</span>
Free (free of charge)
Free for personal and commercial use.
Author: Awesome Content
Similar Free Stock Images

Premium


Premium

Premium


Premium


Premium


Premium


Premium


Premium


Premium


Premium

Premium


Premium


Premium


Premium


Premium


Premium


Premium


Premium


Premium

Premium


Premium


Premium

Premium


Premium


Premium


Explore More Free Stock Images