- Home >
- Stock Photos >
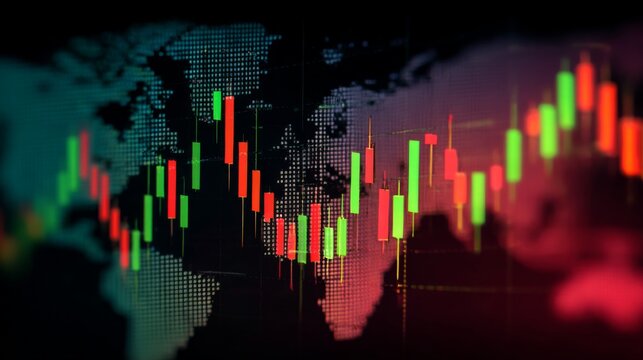
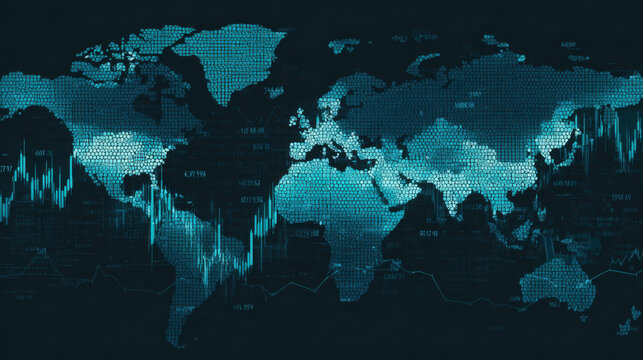
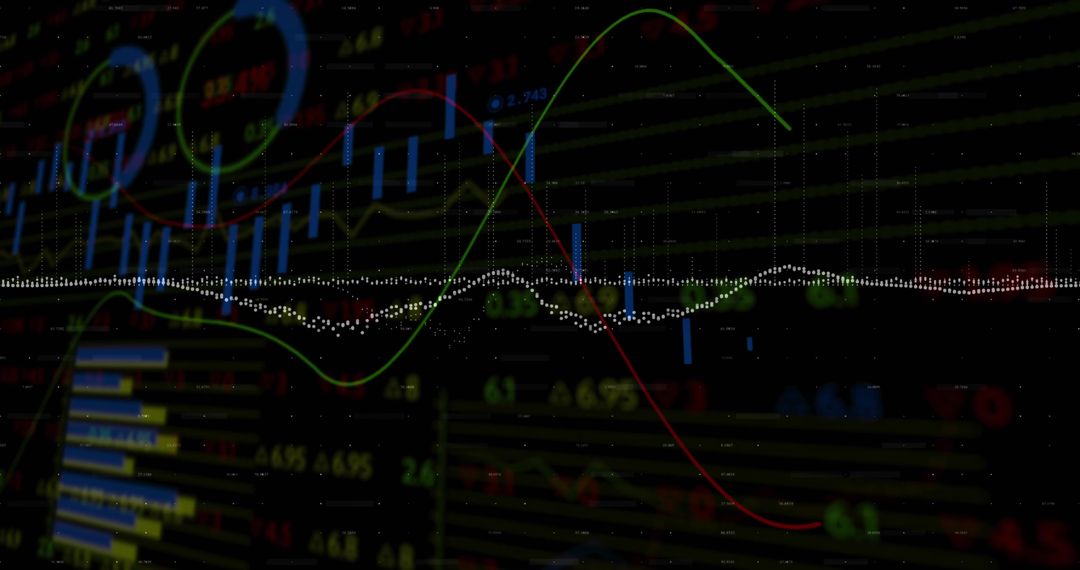
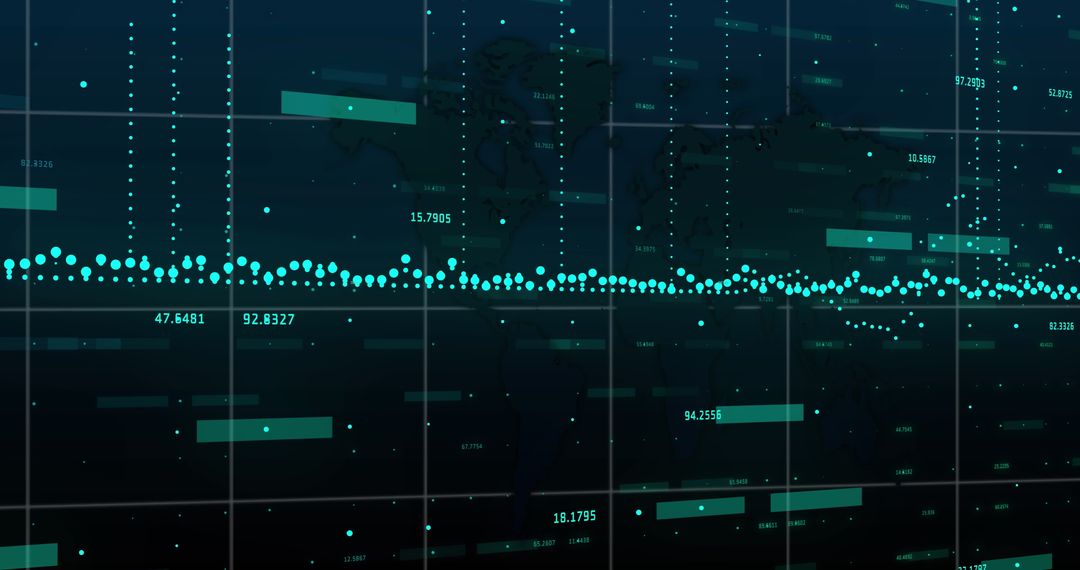
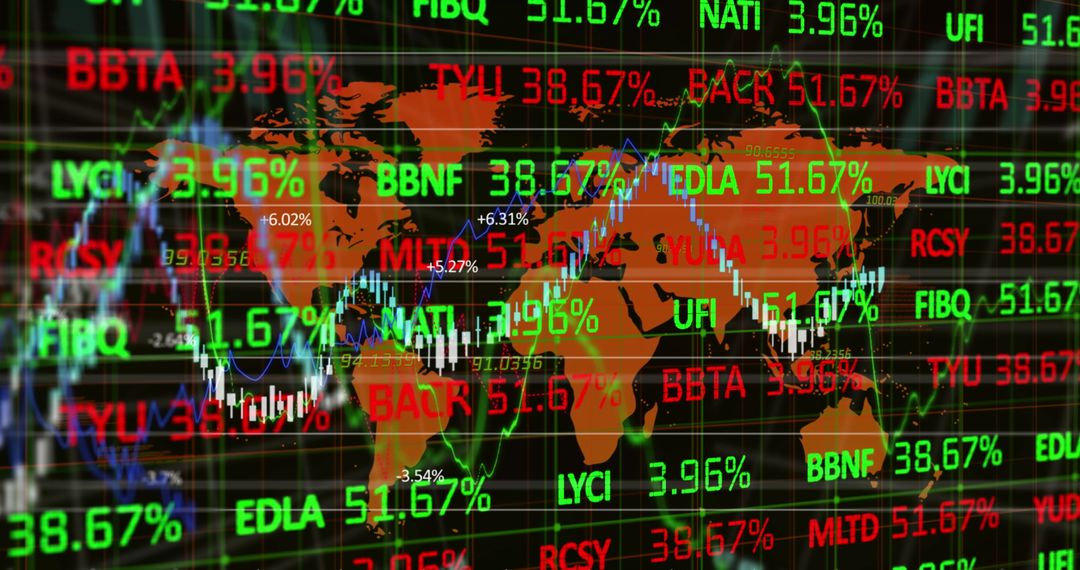
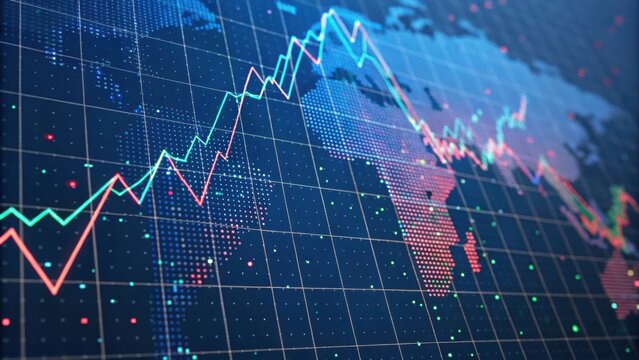
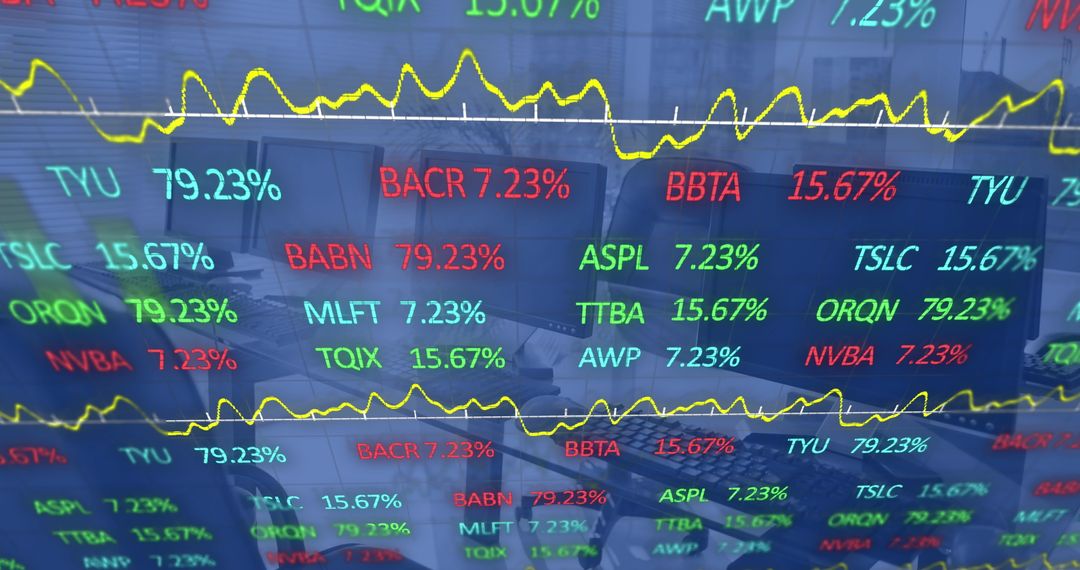
- Global Data Visualization with Financial Metrics and World Map
Global Data Visualization with Financial Metrics and World Map Image

Scene illustrates world economy and financial flows with digital data overlay. Visualization suggests concepts of market analysis, international business, trend analytics. Ideal for articles on global finance, economics, big data technology.
Powered by 


2
downloads
downloads
Tags:
More
Credit Photo
If you would like to credit the Photo, here are some ways you can do so
Text Link
photo Link
<span class="text-link">
<span>
<a target="_blank" href=https://pikwizard.com/photo/global-data-visualization-with-financial-metrics-and-world-map/408806255c0510c66f6af3491ac4a093/>PikWizard</a>
</span>
</span>
<span class="image-link">
<span
style="margin: 0 0 20px 0; display: inline-block; vertical-align: middle; width: 100%;"
>
<a
target="_blank"
href="https://pikwizard.com/photo/global-data-visualization-with-financial-metrics-and-world-map/408806255c0510c66f6af3491ac4a093/"
style="text-decoration: none; font-size: 10px; margin: 0;"
>
<img src="https://pikwizard.com/pw/medium/408806255c0510c66f6af3491ac4a093.jpg" style="margin: 0; width: 100%;" alt="" />
<p style="font-size: 12px; margin: 0;">PikWizard</p>
</a>
</span>
</span>
Free (free of charge)
Free for personal and commercial use.
Author: People Creations
Similar Free Stock Images

Premium


Premium


Premium


Premium


Premium


Premium


Premium


Premium


Premium


Premium


Premium


Premium


Premium


Premium


Premium


Premium


Premium


Premium


Premium


Premium


Premium


Premium


Premium


Premium