- Home >
- Stock Photos >
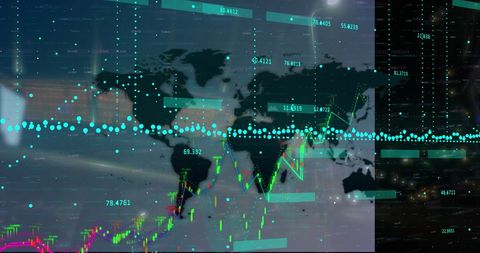
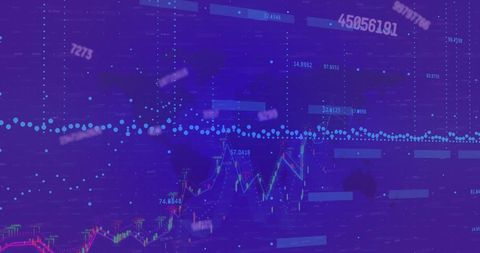
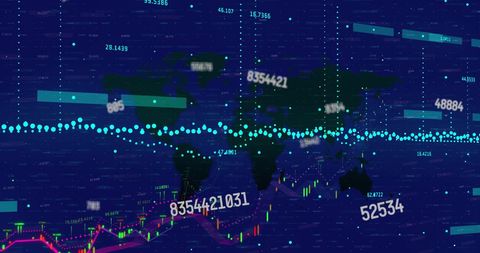
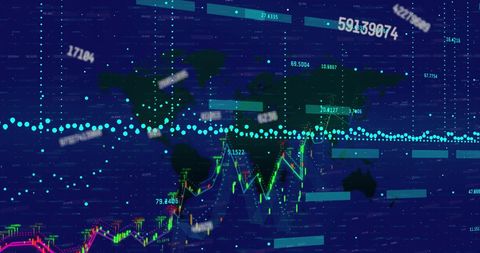
- Global Data Visualization with Financial Statistics and Technology Elements
Global Data Visualization with Financial Statistics and Technology Elements Image

Illustration of digital display projecting financial data over a world map, reflecting the interconnectedness of global financial markets and technology. Suitable for use in contexts related to big data, global finance, economic analysis, digital communication strategies, or technology integration themes.

downloads
Tags:
More
Credit Photo
If you would like to credit the Photo, here are some ways you can do so
Text Link
photo Link
<span class="text-link">
<span>
<a target="_blank" href=https://pikwizard.com/photo/global-data-visualization-with-financial-statistics-and-technology-elements/f8993f596ce7441a04379591749fba87/>PikWizard</a>
</span>
</span>
<span class="image-link">
<span
style="margin: 0 0 20px 0; display: inline-block; vertical-align: middle; width: 100%;"
>
<a
target="_blank"
href="https://pikwizard.com/photo/global-data-visualization-with-financial-statistics-and-technology-elements/f8993f596ce7441a04379591749fba87/"
style="text-decoration: none; font-size: 10px; margin: 0;"
>
<img src="https://pikwizard.com/pw/medium/f8993f596ce7441a04379591749fba87.jpg" style="margin: 0; width: 100%;" alt="" />
<p style="font-size: 12px; margin: 0;">PikWizard</p>
</a>
</span>
</span>
Free (free of charge)
Free for personal and commercial use.
Author: People Creations