
- Home >
- Stock Photos >
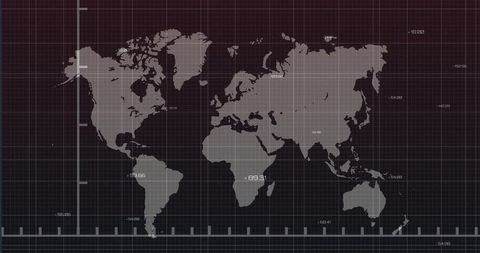
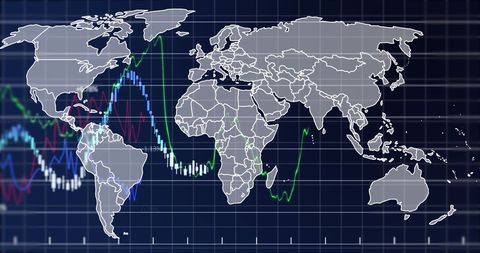
- Global Data Visualization with Graph Over World Map
Global Data Visualization with Graph Over World Map Image

Complex network of digital data points, world map appears futuristic. Ideal for technology presentations, analytics firms, educational materials on data growth or globalization trends.
Powered by 


downloads
Tags:
More
Credit Photo
If you would like to credit the Photo, here are some ways you can do so
Text Link
photo Link
<span class="text-link">
<span>
<a target="_blank" href=https://pikwizard.com/photo/global-data-visualization-with-graph-over-world-map/9a7892ed7a7857dc3840b0f6fe3ee512/>PikWizard</a>
</span>
</span>
<span class="image-link">
<span
style="margin: 0 0 20px 0; display: inline-block; vertical-align: middle; width: 100%;"
>
<a
target="_blank"
href="https://pikwizard.com/photo/global-data-visualization-with-graph-over-world-map/9a7892ed7a7857dc3840b0f6fe3ee512/"
style="text-decoration: none; font-size: 10px; margin: 0;"
>
<img src="https://pikwizard.com/pw/medium/9a7892ed7a7857dc3840b0f6fe3ee512.jpg" style="margin: 0; width: 100%;" alt="" />
<p style="font-size: 12px; margin: 0;">PikWizard</p>
</a>
</span>
</span>
Free (free of charge)
Free for personal and commercial use.
Author: Authentic Images
Similar Free Stock Images

Premium


Premium


Premium

Premium


Premium


Premium


Premium


Premium

Premium

Premium


Premium

Premium

Premium

Premium


Premium


Premium

Premium


Premium


Premium


Premium


Premium


Premium

Premium

Premium


Premium


Explore More Free Stock Images