- Home >
- Stock Photos >
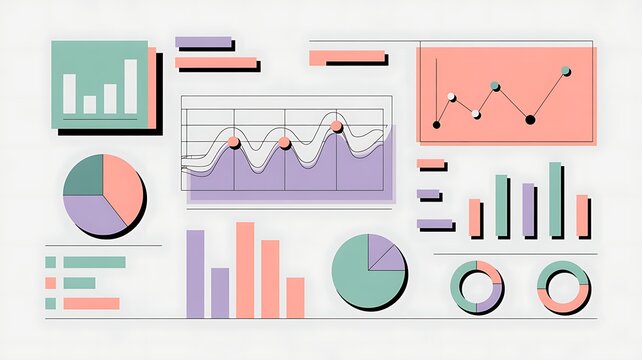
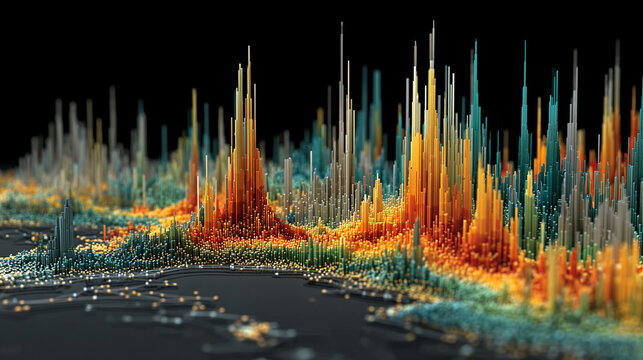
- Global Data Visualization with Graphs and Charts in Purple Tones
Global Data Visualization with Graphs and Charts in Purple Tones Image

Abstract representation of global data through graphs and charts on world map in various shades of purple. Useful for illustrating concepts in analytics, statistics, business insights, and digital data visualization. Ideal for use in presentations, web design backgrounds, and educational materials that focus on data-driven topics.
Powered by 


2
downloads
downloads
Tags:
More
Credit Photo
If you would like to credit the Photo, here are some ways you can do so
Text Link
photo Link
<span class="text-link">
<span>
<a target="_blank" href=https://pikwizard.com/photo/global-data-visualization-with-graphs-and-charts-in-purple-tones/45e19ad4da44a4126817ad65f30fad52/>PikWizard</a>
</span>
</span>
<span class="image-link">
<span
style="margin: 0 0 20px 0; display: inline-block; vertical-align: middle; width: 100%;"
>
<a
target="_blank"
href="https://pikwizard.com/photo/global-data-visualization-with-graphs-and-charts-in-purple-tones/45e19ad4da44a4126817ad65f30fad52/"
style="text-decoration: none; font-size: 10px; margin: 0;"
>
<img src="https://pikwizard.com/pw/medium/45e19ad4da44a4126817ad65f30fad52.jpg" style="margin: 0; width: 100%;" alt="" />
<p style="font-size: 12px; margin: 0;">PikWizard</p>
</a>
</span>
</span>
Free (free of charge)
Free for personal and commercial use.
Author: Awesome Content
Similar Free Stock Images

Premium


Premium


Premium


Premium


Premium


Premium


Premium


Premium


Premium


Premium


Premium


Premium


Premium


Premium


Premium


Premium


Premium


Premium


Premium


Premium


Premium


Premium


Premium


Premium