
- Home >
- Stock Photos >
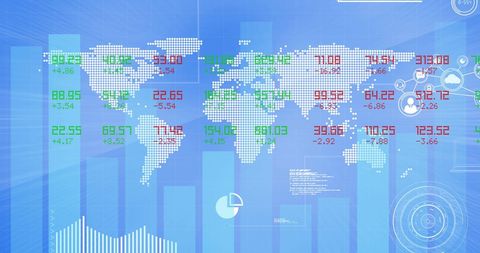
- Global Data Visualization with Graphs and World Connection
Global Data Visualization with Graphs and World Connection Image

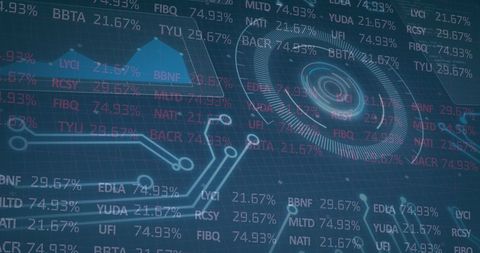
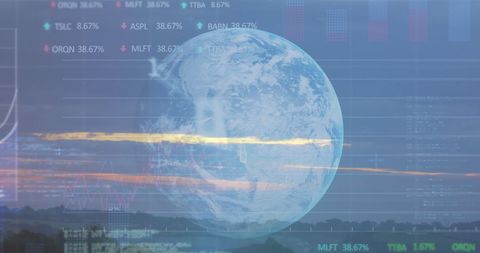
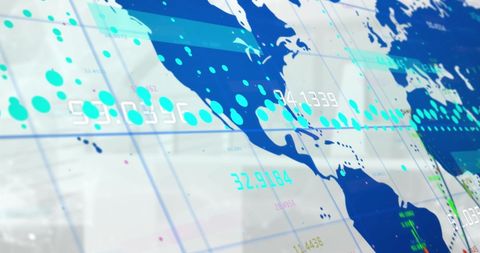
Depicts futuristic digital interface combining world map with fluctuating financial graphs, emphasizing global connectivity and economic data analysis. Useful for technology websites, financial presentations, economic reports, or articles on global connectivity and data-driven solutions.
Powered by 


downloads
Tags:
More
Credit Photo
If you would like to credit the Photo, here are some ways you can do so
Text Link
photo Link
<span class="text-link">
<span>
<a target="_blank" href=https://pikwizard.com/photo/global-data-visualization-with-graphs-and-world-connection/19b3e95f5bf3c384aad1c5283c0a7338/>PikWizard</a>
</span>
</span>
<span class="image-link">
<span
style="margin: 0 0 20px 0; display: inline-block; vertical-align: middle; width: 100%;"
>
<a
target="_blank"
href="https://pikwizard.com/photo/global-data-visualization-with-graphs-and-world-connection/19b3e95f5bf3c384aad1c5283c0a7338/"
style="text-decoration: none; font-size: 10px; margin: 0;"
>
<img src="https://pikwizard.com/pw/medium/19b3e95f5bf3c384aad1c5283c0a7338.jpg" style="margin: 0; width: 100%;" alt="" />
<p style="font-size: 12px; margin: 0;">PikWizard</p>
</a>
</span>
</span>
Free (free of charge)
Free for personal and commercial use.
Author: People Creations
Similar Free Stock Images

Premium


Premium


Premium


Premium


Premium


Premium


Premium


Premium


Premium


Premium


Premium


Premium


Premium

Premium


Premium


Premium


Premium


Premium


Premium


Premium


Premium


Premium


Premium

Premium


Premium


Explore More Free Stock Images