
- Home >
- Stock Photos >
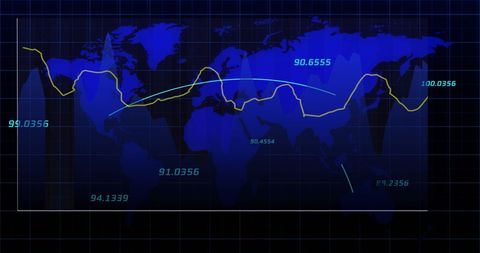
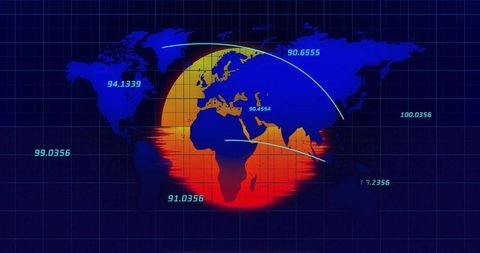
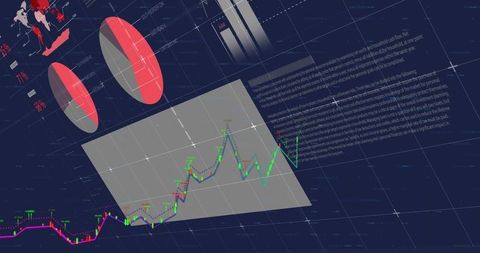
- Global Data Visualization with Interactive Graphs and Charts on Dark Interface
Global Data Visualization with Interactive Graphs and Charts on Dark Interface Image
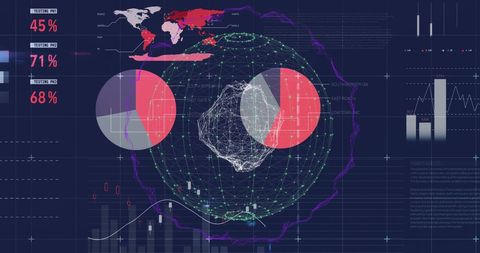
Illustration of global data analysis showing interactive charts and digital graphics on a dark-themed interface. Effective for portraying advanced technology, global connectivity, or used in contexts like digital marketing, data science, business intelligence, and financial analysis presentations. Ideal for illustrating concepts in analytic reports, websites, or educational content about data-driven decision making.
Powered by 


downloads
Tags:
More
Credit Photo
If you would like to credit the Photo, here are some ways you can do so
Text Link
photo Link
<span class="text-link">
<span>
<a target="_blank" href=https://pikwizard.com/photo/global-data-visualization-with-interactive-graphs-and-charts-on-dark-interface/cb94b66806669917b7d634311dbad8ea/>PikWizard</a>
</span>
</span>
<span class="image-link">
<span
style="margin: 0 0 20px 0; display: inline-block; vertical-align: middle; width: 100%;"
>
<a
target="_blank"
href="https://pikwizard.com/photo/global-data-visualization-with-interactive-graphs-and-charts-on-dark-interface/cb94b66806669917b7d634311dbad8ea/"
style="text-decoration: none; font-size: 10px; margin: 0;"
>
<img src="https://pikwizard.com/pw/medium/cb94b66806669917b7d634311dbad8ea.jpg" style="margin: 0; width: 100%;" alt="" />
<p style="font-size: 12px; margin: 0;">PikWizard</p>
</a>
</span>
</span>
Free (free of charge)
Free for personal and commercial use.
Author: Awesome Content
Similar Free Stock Images

Premium


Premium

Premium

Premium


Premium

Premium


Premium


Premium

Premium

Premium


Premium


Premium


Premium

Premium

Premium


Premium

Premium

Premium


Premium


Premium


Premium


Premium

Premium


Premium


Premium

Explore More Free Stock Images