- Home >
- Stock Photos >
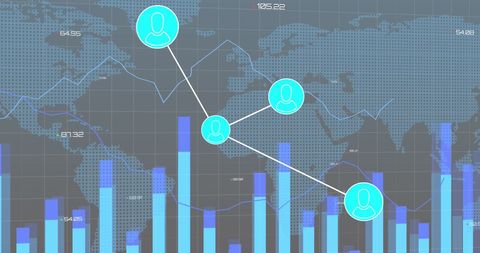
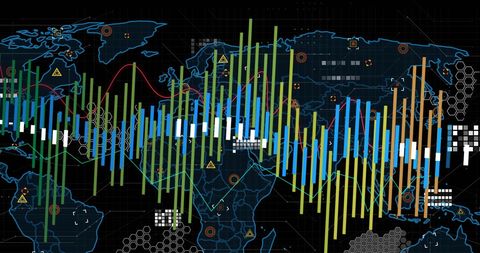
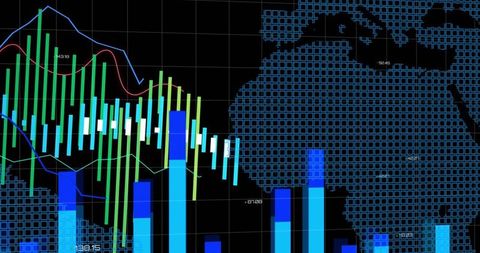
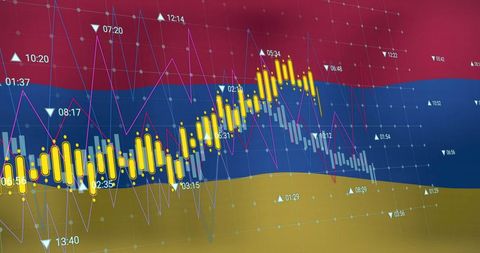
- Global Data Visualization with Interactive Graphs and Network Nodes
Global Data Visualization with Interactive Graphs and Network Nodes Image

This visualization showcases a sophisticated integration of global data using various graphical representations like bar graphs, line graphs, and interconnected nodes. The overlaid mesh and data grid convey complex analytics and information flow, perfect for presentations on technology, business intelligence, and geography. Use this to highlight data analysis concepts, digital innovation, and global trends in seminars, reports, and tech applications.

downloads
Tags:
More
Credit Photo
If you would like to credit the Photo, here are some ways you can do so
Text Link
photo Link
<span class="text-link">
<span>
<a target="_blank" href=https://pikwizard.com/photo/global-data-visualization-with-interactive-graphs-and-network-nodes/bbd9258ad84fbcb337cdd9b5110a0b92/>PikWizard</a>
</span>
</span>
<span class="image-link">
<span
style="margin: 0 0 20px 0; display: inline-block; vertical-align: middle; width: 100%;"
>
<a
target="_blank"
href="https://pikwizard.com/photo/global-data-visualization-with-interactive-graphs-and-network-nodes/bbd9258ad84fbcb337cdd9b5110a0b92/"
style="text-decoration: none; font-size: 10px; margin: 0;"
>
<img src="https://pikwizard.com/pw/medium/bbd9258ad84fbcb337cdd9b5110a0b92.jpg" style="margin: 0; width: 100%;" alt="" />
<p style="font-size: 12px; margin: 0;">PikWizard</p>
</a>
</span>
</span>
Free (free of charge)
Free for personal and commercial use.
Author: Creative Art