- Home >
- Stock Photos >
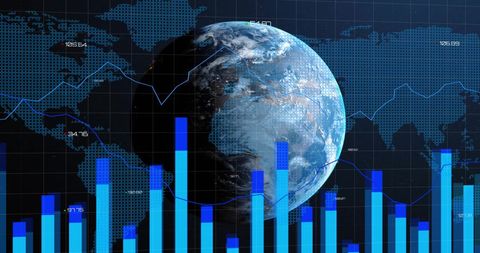
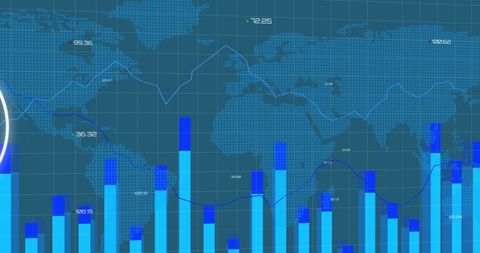
- Global Data Visualization with Interactive Graphs
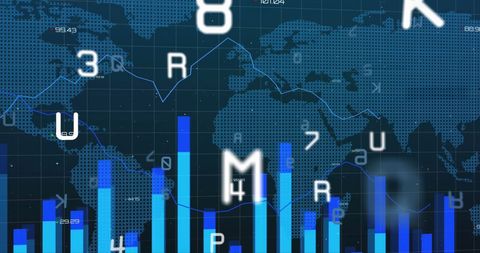
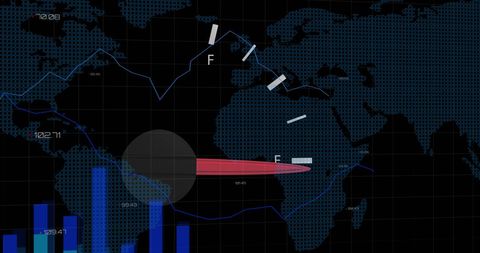
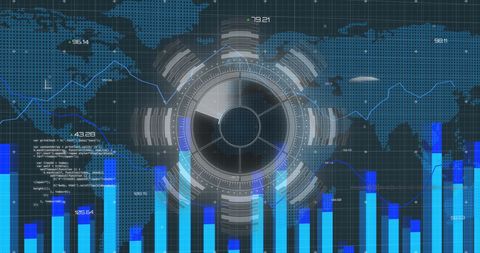
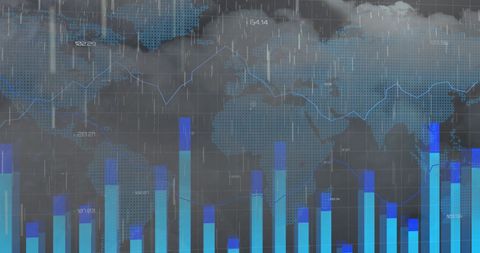
Global Data Visualization with Interactive Graphs Image
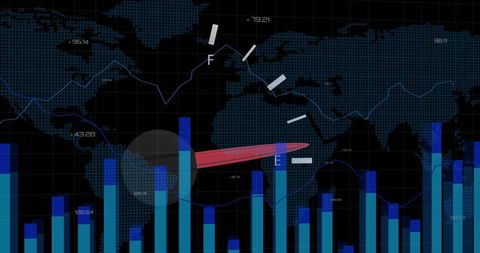
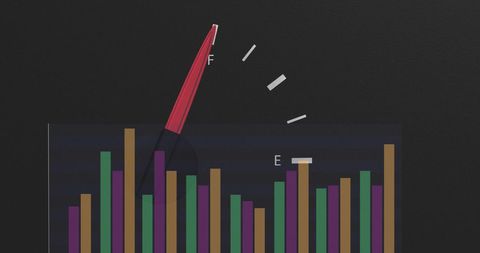
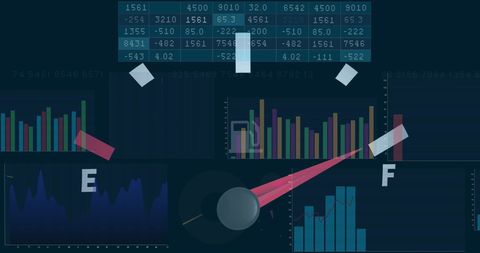
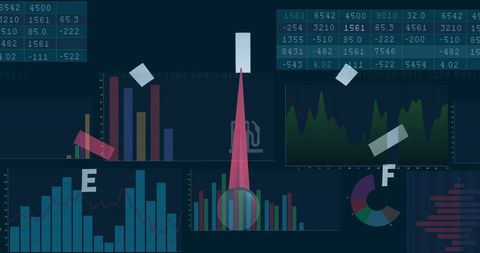
Features merging world map with blue bar and line graphs, representing global data processing and financial analytics. Suitable for business presentations, articles about international finance, and tech-themed designs. Highlights the intersection of digital finance and global business reporting.

downloads
Tags:
More
Credit Photo
If you would like to credit the Photo, here are some ways you can do so
Text Link
photo Link
<span class="text-link">
<span>
<a target="_blank" href=https://pikwizard.com/photo/global-data-visualization-with-interactive-graphs/92c86ad00c162ecbee79ed5986fb4f4e/>PikWizard</a>
</span>
</span>
<span class="image-link">
<span
style="margin: 0 0 20px 0; display: inline-block; vertical-align: middle; width: 100%;"
>
<a
target="_blank"
href="https://pikwizard.com/photo/global-data-visualization-with-interactive-graphs/92c86ad00c162ecbee79ed5986fb4f4e/"
style="text-decoration: none; font-size: 10px; margin: 0;"
>
<img src="https://pikwizard.com/pw/medium/92c86ad00c162ecbee79ed5986fb4f4e.jpg" style="margin: 0; width: 100%;" alt="" />
<p style="font-size: 12px; margin: 0;">PikWizard</p>
</a>
</span>
</span>
Free (free of charge)
Free for personal and commercial use.
Author: People Creations