
- Home >
- Stock Photos >
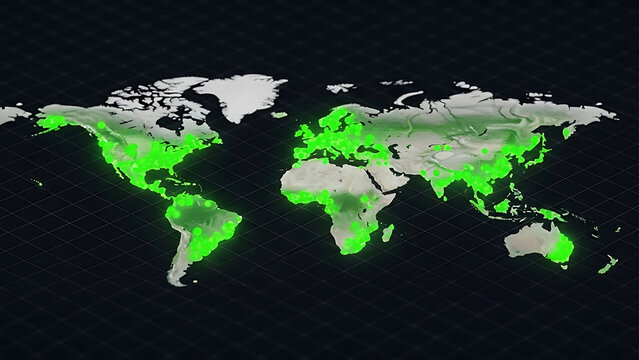
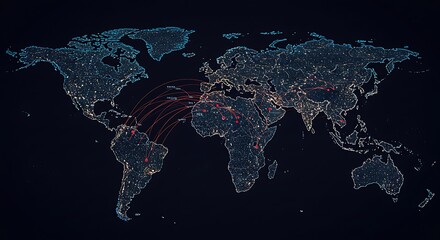
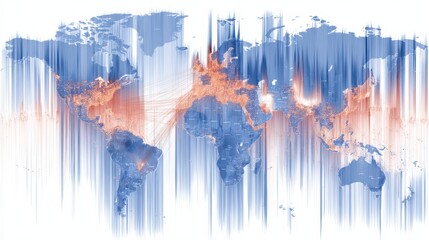
- Global Data Visualization with Interactive World Map, Financial Charts and Analytics Dashboard
Global Data Visualization with Interactive World Map, Financial Charts and Analytics Dashboard Image

Depicting blue world map over teal grid with cyan data line, floating data points, magenta trend charts, numeric overlays, and translucent dashboard panels. Conveying global finance, market analysis, geospatial analytics, and big data trends with modern high-tech aesthetic. Ideal for use in website headers, corporate presentations, investor reports, financial news graphics, technology blogs, data science publications, and marketing campaigns. Supporting customization of colors and overlays for brand integration, insertion of headlines and data callouts, or animation for video intros. Works well as background for slide decks, hero banners, dashboards, social media posts, and print collateral. Delivery suggestions: crop for banner formats, add semi-transparent overlay for headline contrast, animate data points for motion graphics, and pair with bold typography for investor or enterprise messaging.
Powered by 


downloads
Tags:
More
Credit Photo
If you would like to credit the Photo, here are some ways you can do so
Text Link
photo Link
<span class="text-link">
<span>
<a target="_blank" href=https://pikwizard.com/photo/global-data-visualization-with-interactive-world-map-financial-charts-and-analytics-dashboard/ddb495c58467eac9d3dc893d4eb2fa3a/>PikWizard</a>
</span>
</span>
<span class="image-link">
<span
style="margin: 0 0 20px 0; display: inline-block; vertical-align: middle; width: 100%;"
>
<a
target="_blank"
href="https://pikwizard.com/photo/global-data-visualization-with-interactive-world-map-financial-charts-and-analytics-dashboard/ddb495c58467eac9d3dc893d4eb2fa3a/"
style="text-decoration: none; font-size: 10px; margin: 0;"
>
<img src="https://pikwizard.com/pw/medium/ddb495c58467eac9d3dc893d4eb2fa3a.jpg" style="margin: 0; width: 100%;" alt="" />
<p style="font-size: 12px; margin: 0;">PikWizard</p>
</a>
</span>
</span>
Free (free of charge)
Free for personal and commercial use.
Author: People Creations
Similar Free Stock Images

Premium


Premium
Premium


Premium


Premium


Premium


Premium

Premium

Premium


Premium

Premium

Premium

Premium


Premium


Premium


Premium


Premium


Premium


Premium


Premium


Premium

Premium


Premium


Premium


Premium
Explore More Free Stock Images