- Home >
- Stock Photos >
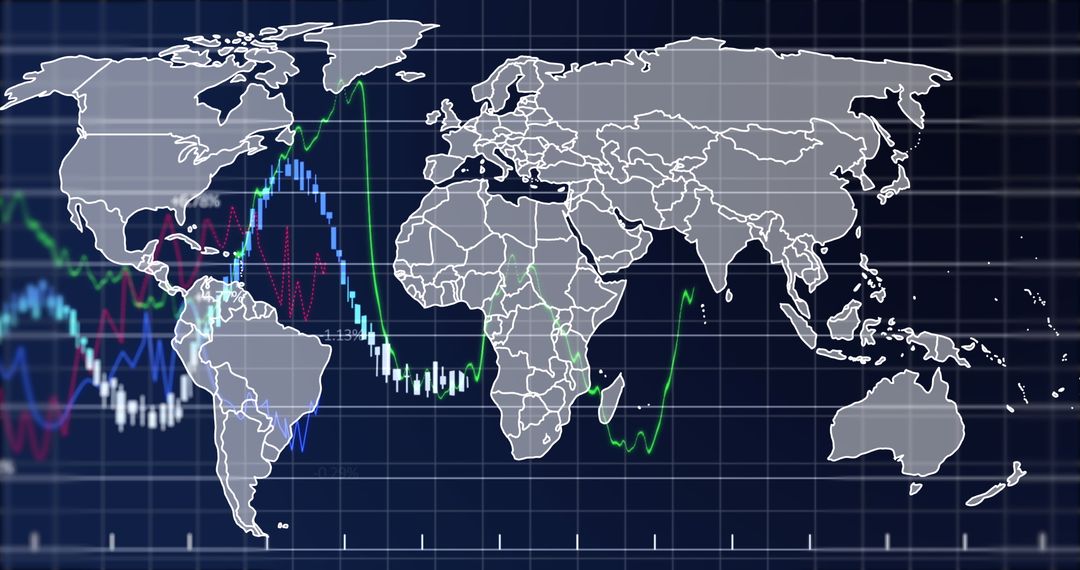
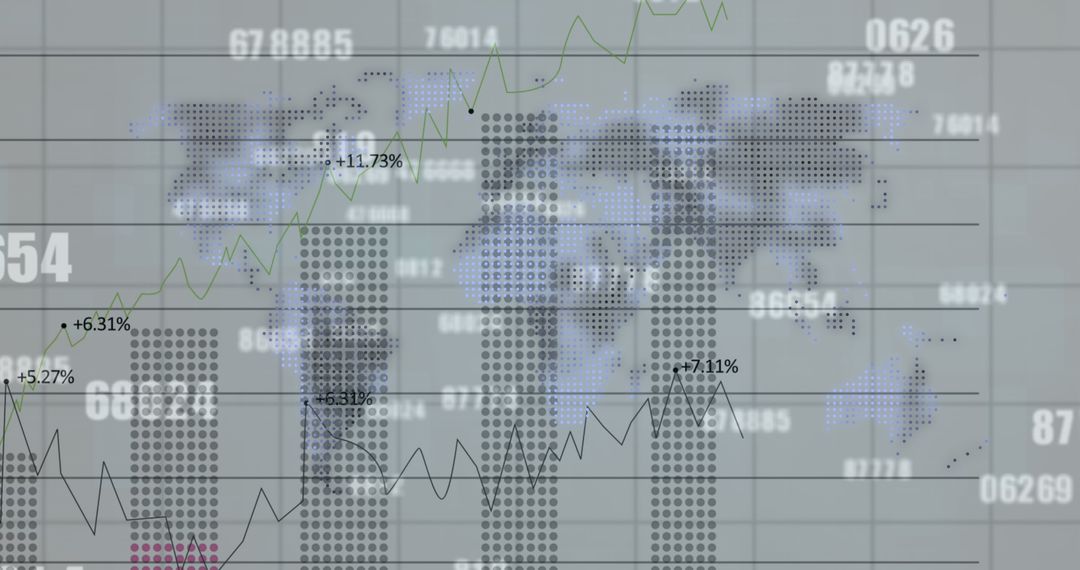
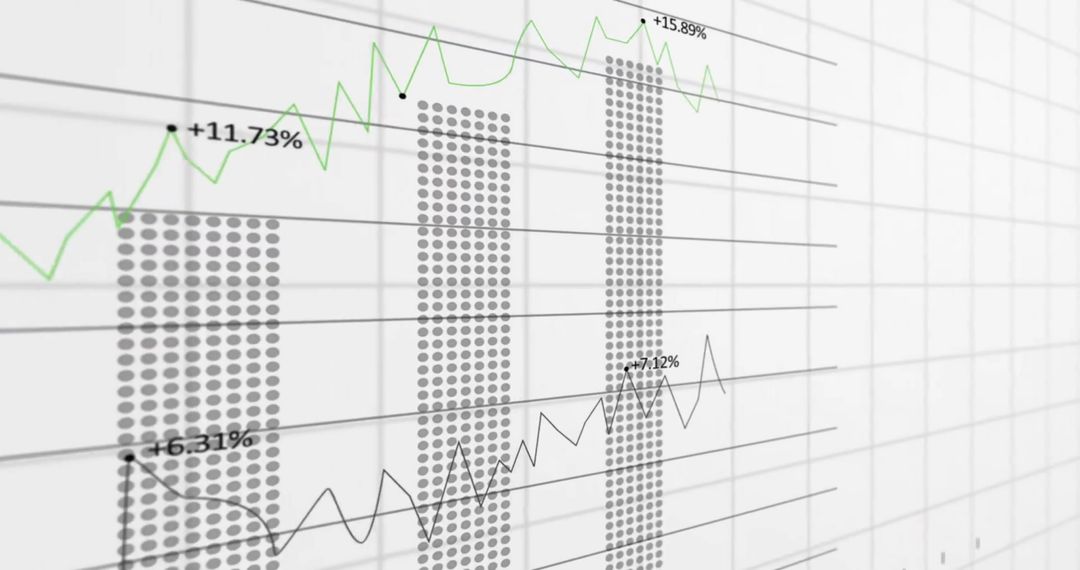
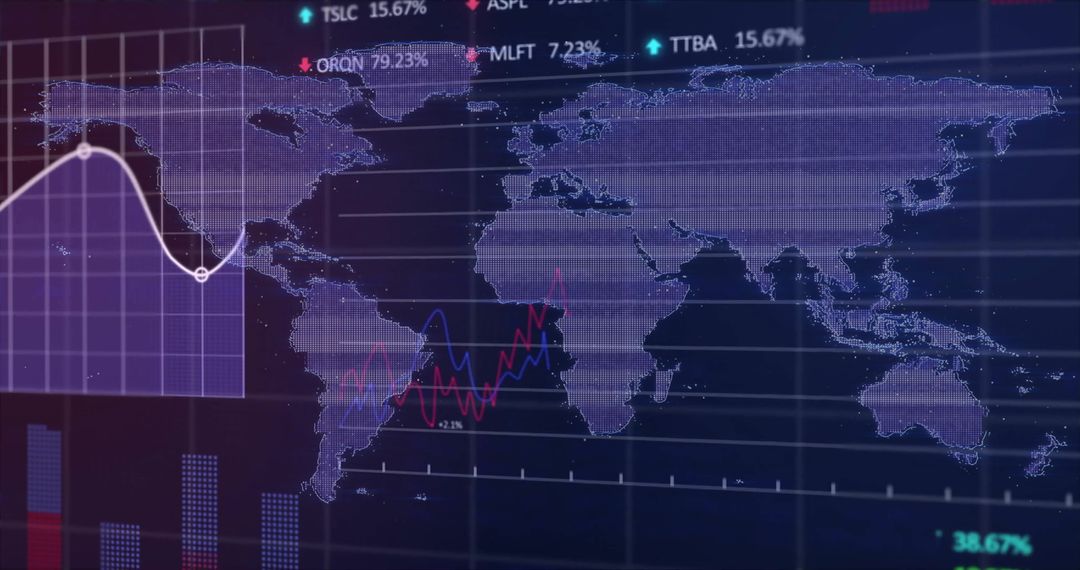
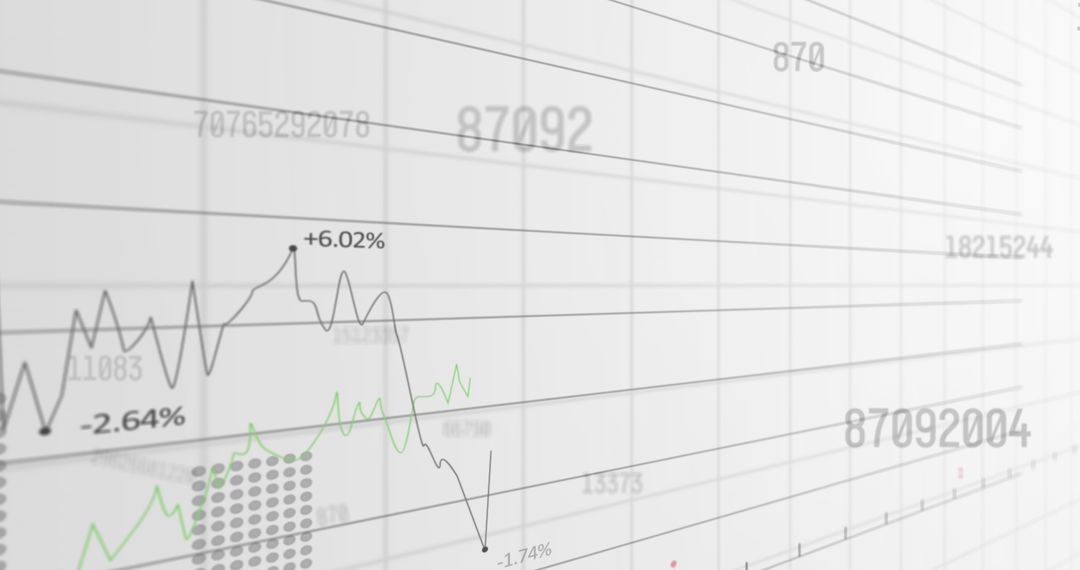
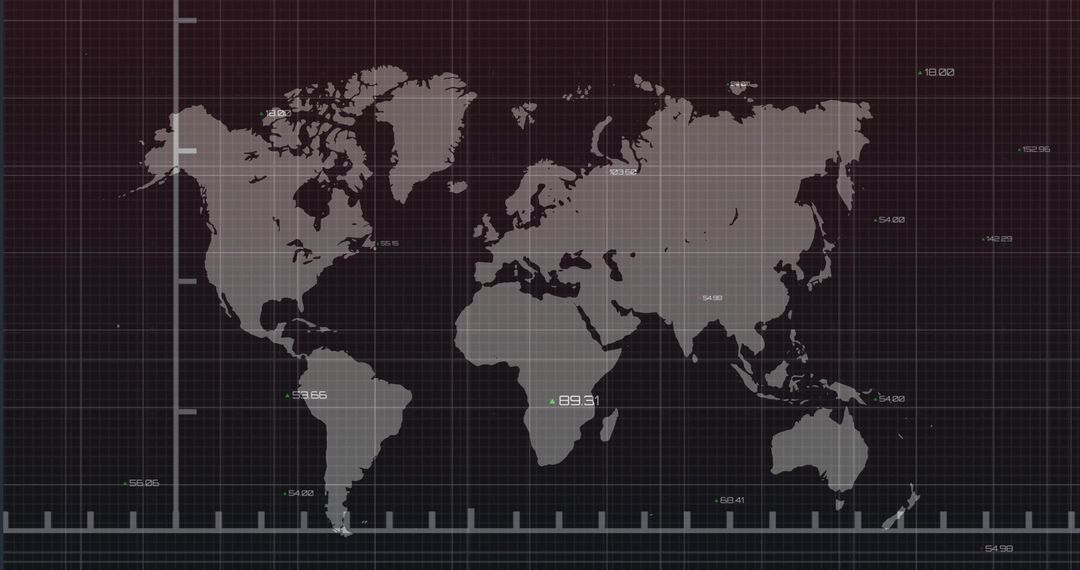
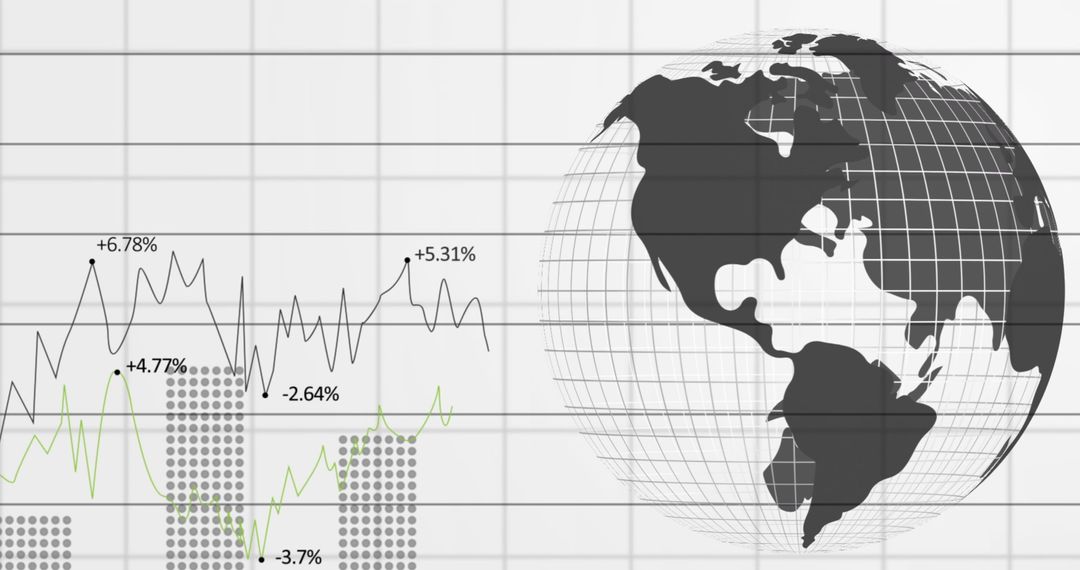
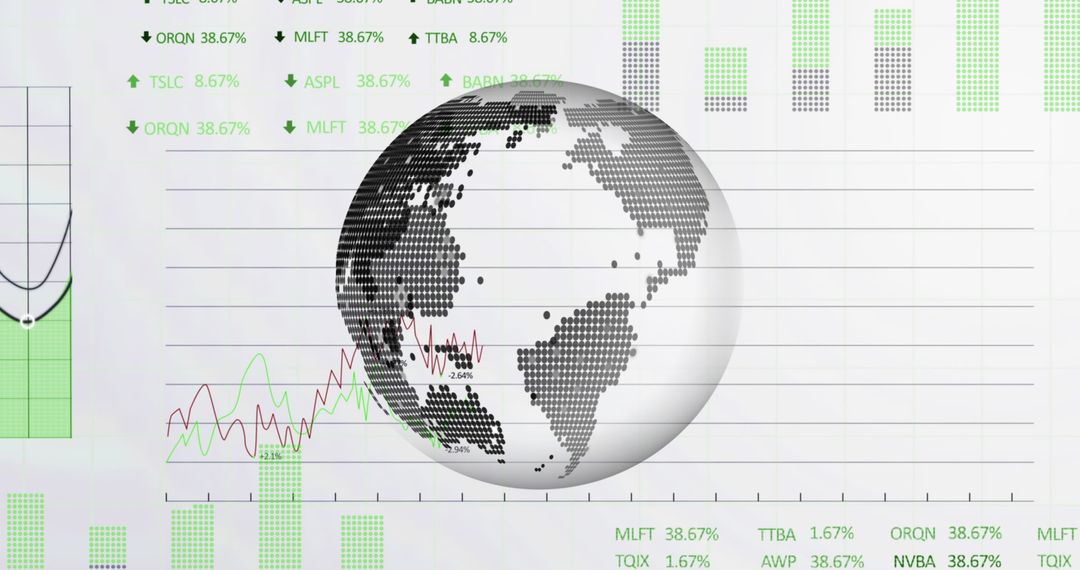
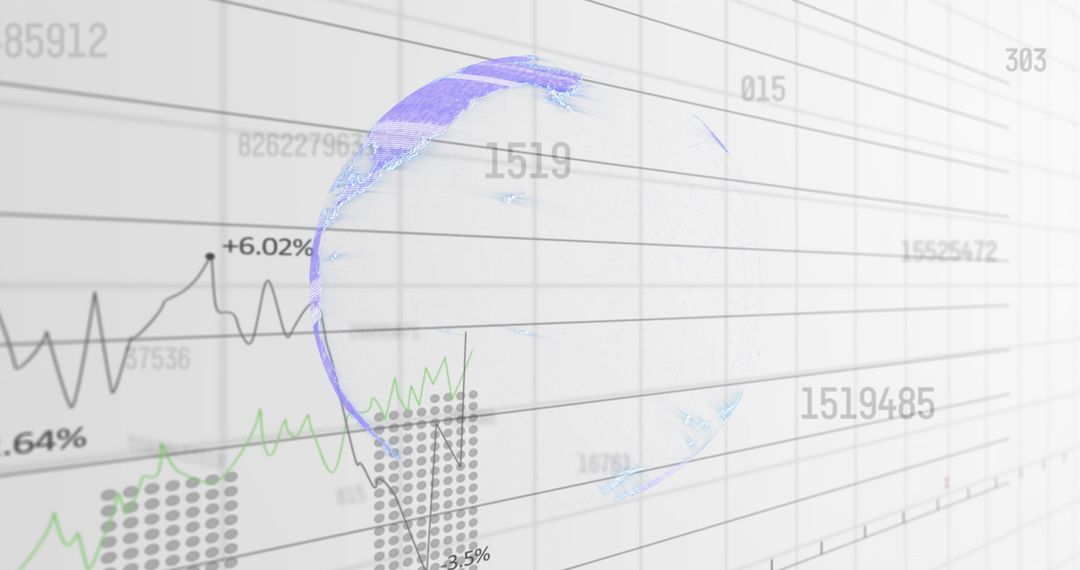
- Global Data Visualization with Market Trends and World Map
Global Data Visualization with Market Trends and World Map Image
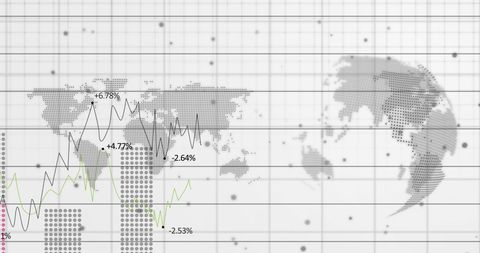
Graphic featuring statistical data processing superimposed on a world map emphasizes international financial analysis and technology trends. Suitable for illustrating global business concepts, finance reports, technological advances in data visualization, and worldwide market trend analysis. Effective for presentations and reports related to global economy insights and digital transformation.
Powered by 


0
downloads
downloads
Tags:
More
Credit Photo
If you would like to credit the Photo, here are some ways you can do so
Text Link
photo Link
<span class="text-link">
<span>
<a target="_blank" href=https://pikwizard.com/photo/global-data-visualization-with-market-trends-and-world-map/3d73db55944303584af09163e5b42068/>PikWizard</a>
</span>
</span>
<span class="image-link">
<span
style="margin: 0 0 20px 0; display: inline-block; vertical-align: middle; width: 100%;"
>
<a
target="_blank"
href="https://pikwizard.com/photo/global-data-visualization-with-market-trends-and-world-map/3d73db55944303584af09163e5b42068/"
style="text-decoration: none; font-size: 10px; margin: 0;"
>
<img src="https://pikwizard.com/pw/medium/3d73db55944303584af09163e5b42068.jpg" style="margin: 0; width: 100%;" alt="" />
<p style="font-size: 12px; margin: 0;">PikWizard</p>
</a>
</span>
</span>
Free (free of charge)
Free for personal and commercial use.
Author: Creative Art
Similar Free Stock Images
Premium


Premium


Premium


Premium


Premium


Premium


Premium


Premium


Premium


Premium


Premium


Premium


Premium


Premium


Premium


Premium


Premium


Premium


Premium


Premium


Premium


Premium


Premium


Premium