
- Home >
- Stock Photos >
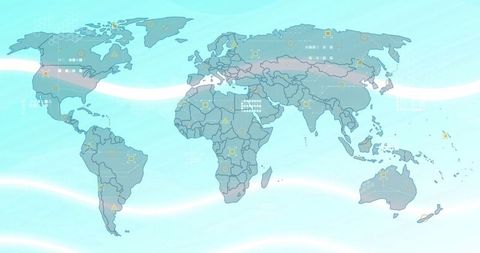
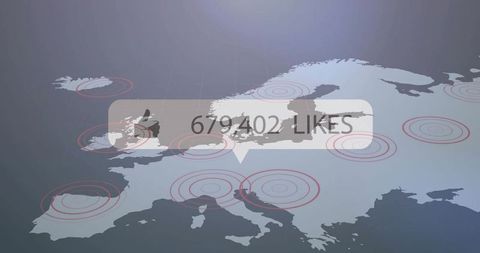
- Global Data Visualization with Overlaid Map Chart Design
Global Data Visualization with Overlaid Map Chart Design Image
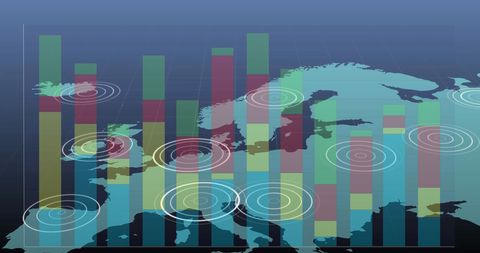
Illustrating concept of global data interaction, ideal for presentations, technology articles, or reports on international politics and technology analytics. Useful in conveying complex data in a visually engaging manner, highlighting regional differences or impacts on geography.
Powered by 


downloads
Tags:
More
Credit Photo
If you would like to credit the Photo, here are some ways you can do so
Text Link
photo Link
<span class="text-link">
<span>
<a target="_blank" href=https://pikwizard.com/photo/global-data-visualization-with-overlaid-map-chart-design/1051bc9a8e47805d470eb44cd66d50c8/>PikWizard</a>
</span>
</span>
<span class="image-link">
<span
style="margin: 0 0 20px 0; display: inline-block; vertical-align: middle; width: 100%;"
>
<a
target="_blank"
href="https://pikwizard.com/photo/global-data-visualization-with-overlaid-map-chart-design/1051bc9a8e47805d470eb44cd66d50c8/"
style="text-decoration: none; font-size: 10px; margin: 0;"
>
<img src="https://pikwizard.com/pw/medium/1051bc9a8e47805d470eb44cd66d50c8.jpg" style="margin: 0; width: 100%;" alt="" />
<p style="font-size: 12px; margin: 0;">PikWizard</p>
</a>
</span>
</span>
Free (free of charge)
Free for personal and commercial use.
Author: Awesome Content
Similar Free Stock Images

Premium


Premium

Premium


Premium


Premium

Premium


Premium


Premium

Premium

Premium


Premium


Premium


Premium

Premium

Premium


Premium


Premium


Premium


Premium


Premium

Premium


Premium


Premium


Premium


Premium


Explore More Free Stock Images