- Home >
- Stock Photos >
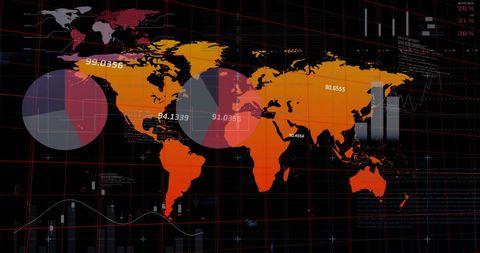
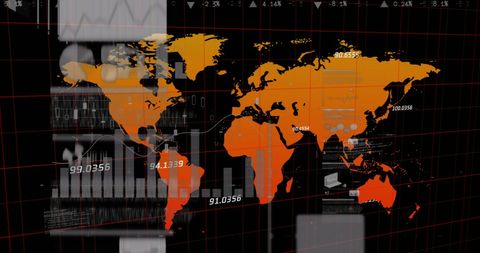
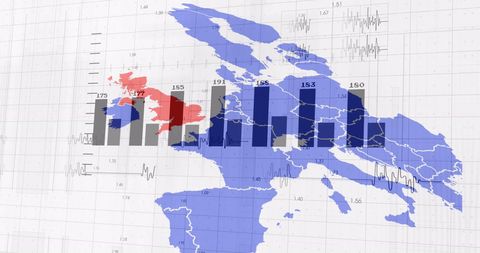
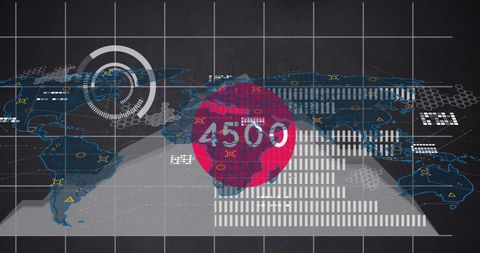
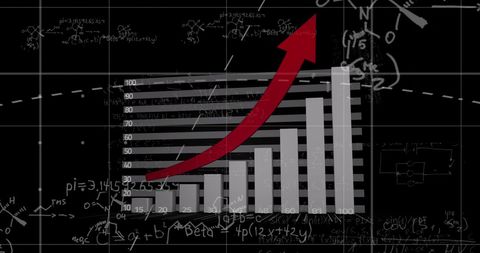
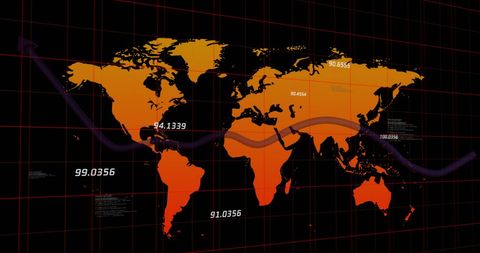
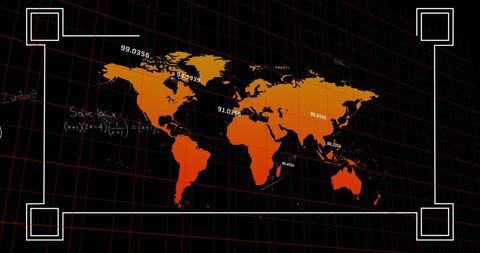
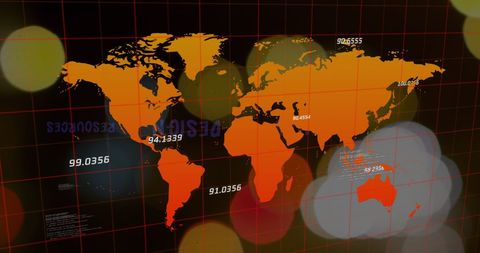
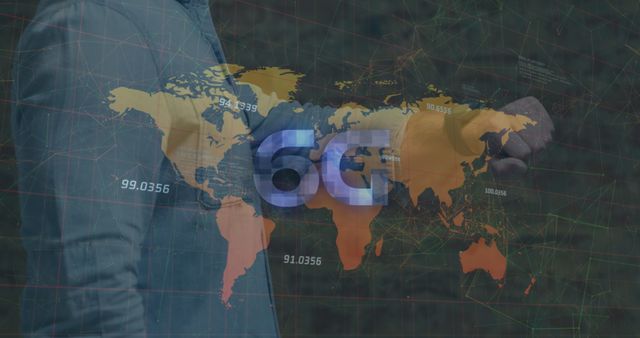
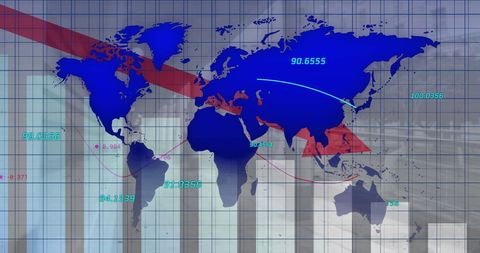
- Global Data Visualization with Rising Bar Graph and Map
Global Data Visualization with Rising Bar Graph and Map Image

Digital representation of data processing featuring a world map overlayed with a bar graph and an upward arrow. This concept symbolizes global business, economic growth, and the influence of digital interfaces. Useful for marketing strategies, finance reports, and presentations related to international trade. Can also be applied in context of analytics software or global insights discussions.

downloads
Tags:
More
Credit Photo
If you would like to credit the Photo, here are some ways you can do so
Text Link
photo Link
<span class="text-link">
<span>
<a target="_blank" href=https://pikwizard.com/photo/global-data-visualization-with-rising-bar-graph-and-map/941c656a818511de5dd2351b21b6df9a/>PikWizard</a>
</span>
</span>
<span class="image-link">
<span
style="margin: 0 0 20px 0; display: inline-block; vertical-align: middle; width: 100%;"
>
<a
target="_blank"
href="https://pikwizard.com/photo/global-data-visualization-with-rising-bar-graph-and-map/941c656a818511de5dd2351b21b6df9a/"
style="text-decoration: none; font-size: 10px; margin: 0;"
>
<img src="https://pikwizard.com/pw/medium/941c656a818511de5dd2351b21b6df9a.jpg" style="margin: 0; width: 100%;" alt="" />
<p style="font-size: 12px; margin: 0;">PikWizard</p>
</a>
</span>
</span>
Free (free of charge)
Free for personal and commercial use.
Author: Creative Art