
- Home >
- Stock Photos >
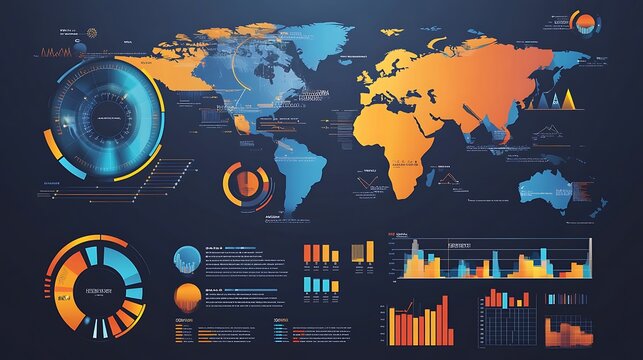
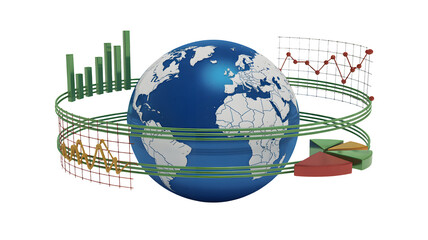
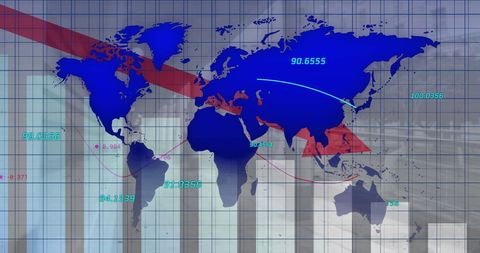
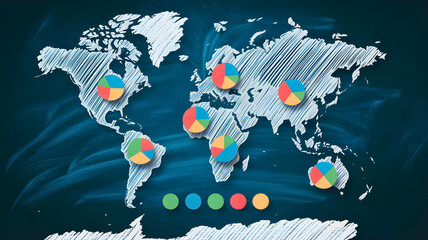
- Global Data Visualization with World Map and Bar Graphs
Global Data Visualization with World Map and Bar Graphs Image

Illustrating comprehensive data analytics with a map overlay, this depiction integrates digital technology and global business strategies. Ideal for use in presentations focused on economic trends, technological advances in data analysis, and business developments across different regions. This motif symbolizes the unification of statistical insights for corporate and academic usage.
Powered by 


downloads
Tags:
More
Credit Photo
If you would like to credit the Photo, here are some ways you can do so
Text Link
photo Link
<span class="text-link">
<span>
<a target="_blank" href=https://pikwizard.com/photo/global-data-visualization-with-world-map-and-bar-graphs/35e2fbdcb1a1ea9a044839a7f14f0bcc/>PikWizard</a>
</span>
</span>
<span class="image-link">
<span
style="margin: 0 0 20px 0; display: inline-block; vertical-align: middle; width: 100%;"
>
<a
target="_blank"
href="https://pikwizard.com/photo/global-data-visualization-with-world-map-and-bar-graphs/35e2fbdcb1a1ea9a044839a7f14f0bcc/"
style="text-decoration: none; font-size: 10px; margin: 0;"
>
<img src="https://pikwizard.com/pw/medium/35e2fbdcb1a1ea9a044839a7f14f0bcc.jpg" style="margin: 0; width: 100%;" alt="" />
<p style="font-size: 12px; margin: 0;">PikWizard</p>
</a>
</span>
</span>
Free (free of charge)
Free for personal and commercial use.
Author: Authentic Images
Similar Free Stock Images

Premium


Premium


Premium


Premium


Premium


Premium


Premium


Premium


Premium


Premium
Premium

Premium


Premium


Premium


Premium


Premium


Premium


Premium


Premium
Premium


Premium


Premium


Premium


Premium

Premium


Explore More Free Stock Images