- Home >
- Stock Photos >
- Global Data Visualization with World Map and Business Charts
Global Data Visualization with World Map and Business Charts Image
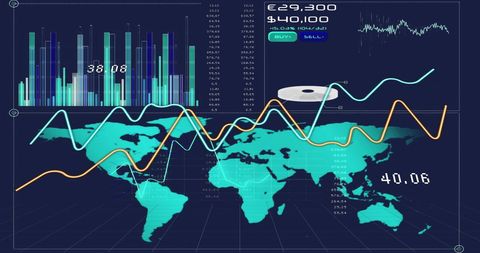
This illustration showcases a dynamic digital interface featuring a world map overlaid with business charts and analytics. It incorporates dynamic line graphs, bar charts, and numerical data, suggesting themes of global business and finance. The use of bright colors and digital fonts highlights a modern, technology-driven environment. This visual can be ideal for use in presentations, articles, or marketing materials relating to themes such as global business analytics, financial forecasting, or international economic insights.
Powered by  - Get 15% off with code: PIKWIZARD15


downloads
Tags:
More
Credit Photo
If you would like to credit the Photo, here are some ways you can do so
Text Link
photo Link
<span class="text-link">
<span>
<a target="_blank" href=https://pikwizard.com/photo/global-data-visualization-with-world-map-and-business-charts/4b0ab8ae96a6c6d48dd98d8b1787bddb/>PikWizard</a>
</span>
</span>
<span class="image-link">
<span
style="margin: 0 0 20px 0; display: inline-block; vertical-align: middle; width: 100%;"
>
<a
target="_blank"
href="https://pikwizard.com/photo/global-data-visualization-with-world-map-and-business-charts/4b0ab8ae96a6c6d48dd98d8b1787bddb/"
style="text-decoration: none; font-size: 10px; margin: 0;"
>
<img src="https://pikwizard.com/pw/medium/4b0ab8ae96a6c6d48dd98d8b1787bddb.jpg" style="margin: 0; width: 100%;" alt="" />
<p style="font-size: 12px; margin: 0;">PikWizard</p>
</a>
</span>
</span>
Free (free of charge)
Free for personal and commercial use.
Author: Awesome Content
Similar Free Stock Images
Loading...

Premium


Premium


Premium


Premium


Premium


Premium


Premium


Premium

Premium

Premium


Premium


Premium

Premium

Premium


Premium


Premium

Premium


Premium
Premium

Premium

Premium


Premium


Premium


Premium


Premium